Review
. 2010 Mar;29(2):95-112.
doi: 10.1016/j.preteyeres.2009.11.003. Epub 2009 Dec 2.

The pivotal role of the complement system in aging and age-related macular degeneration: hypothesis re-visited

Affiliations
Review

The pivotal role of the complement system in aging and age-related macular degeneration: hypothesis re-visited

Don H Anderson et al. Prog Retin Eye Res. 2010 Mar.

Abstract

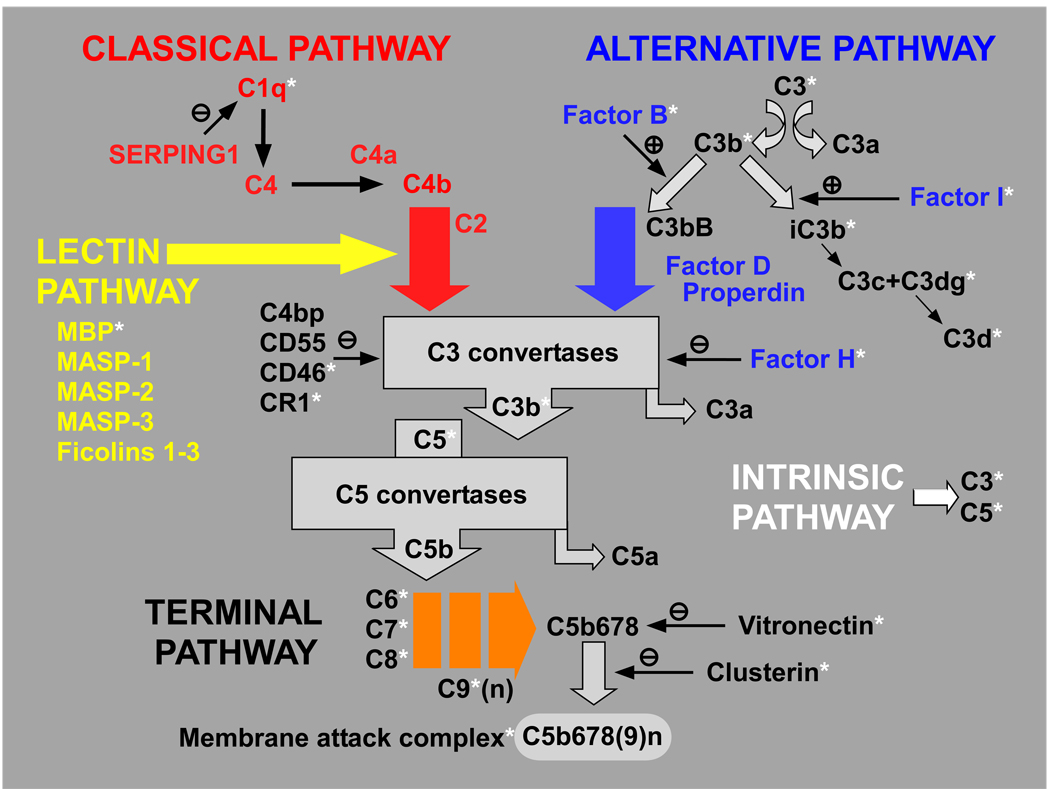
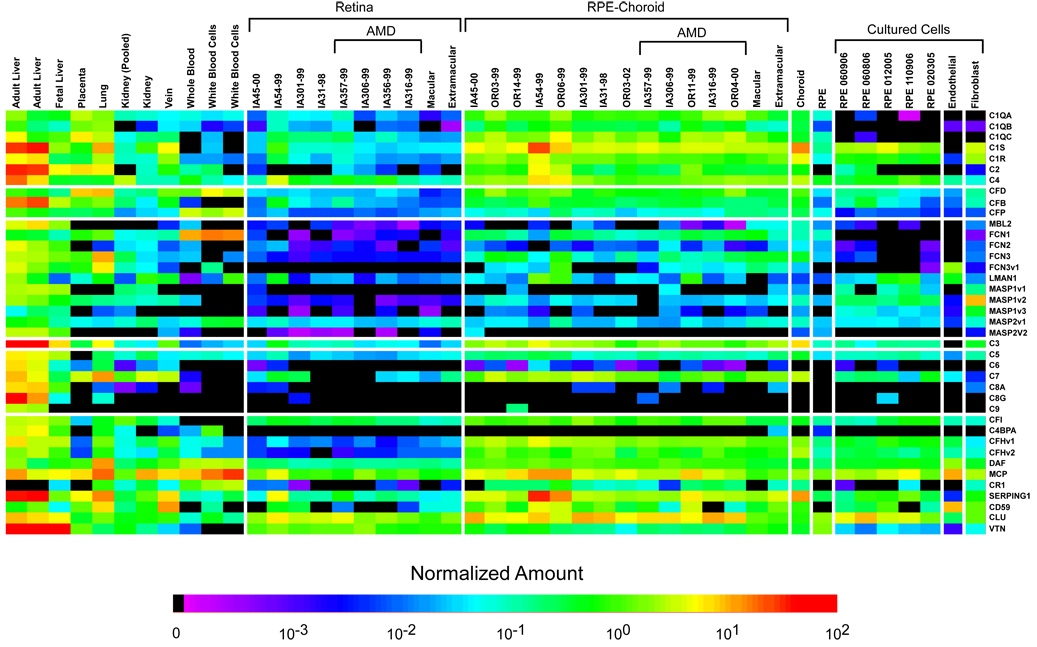
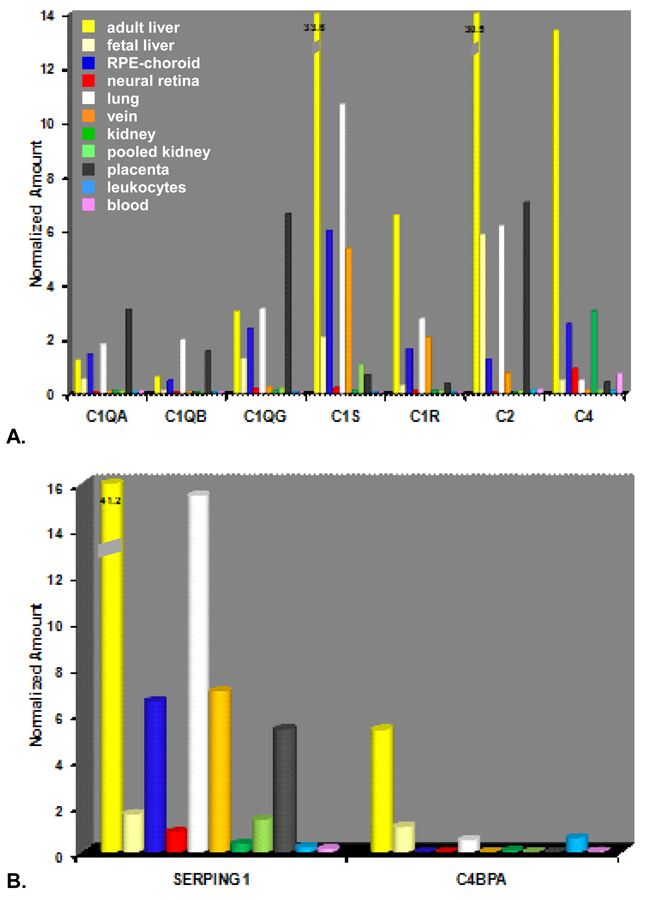
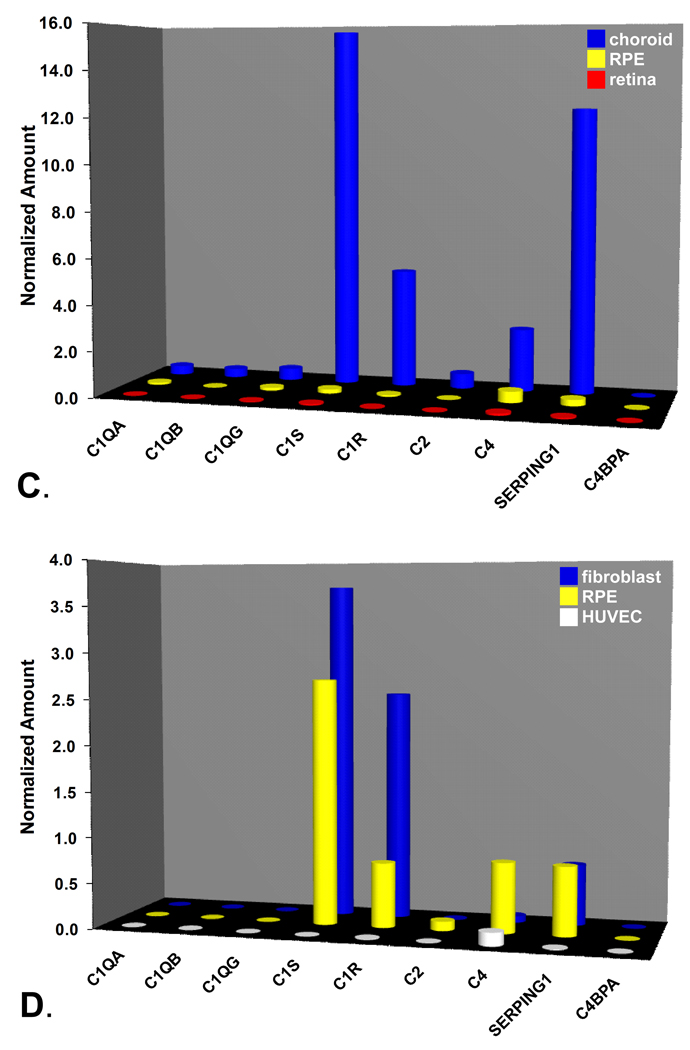
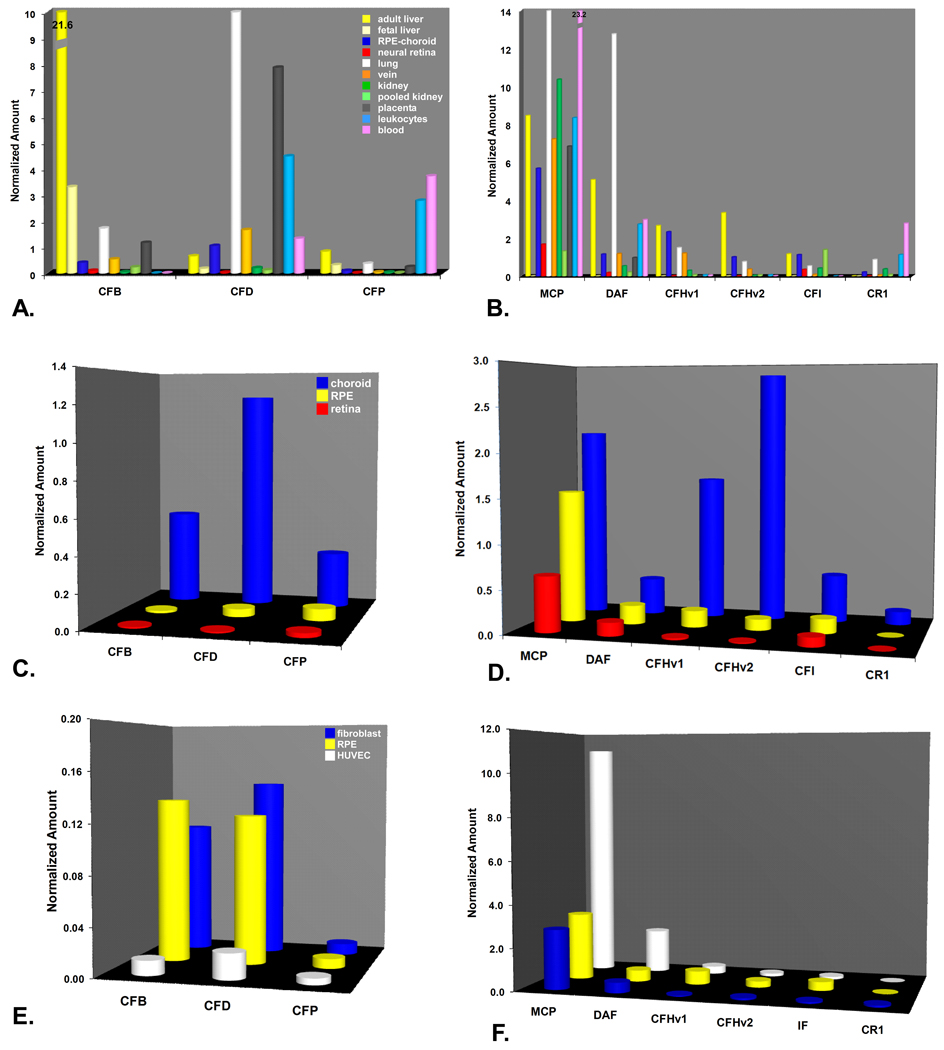
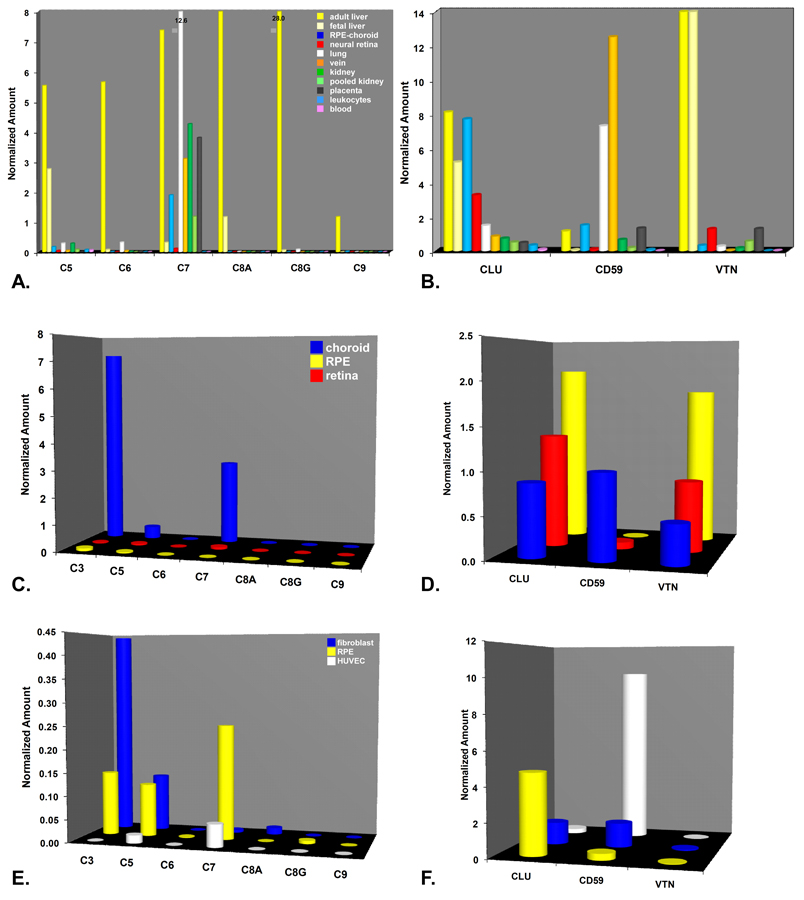
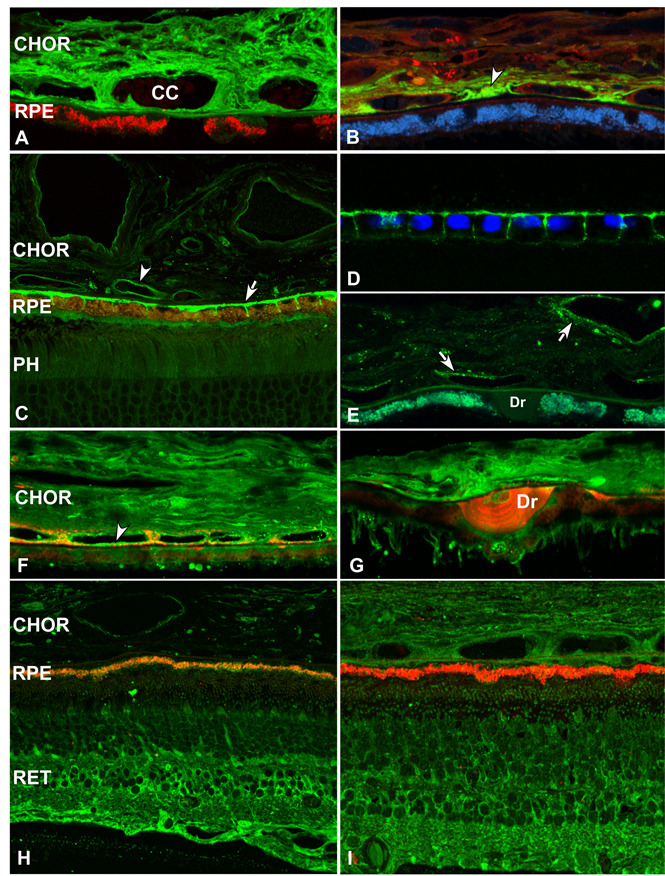
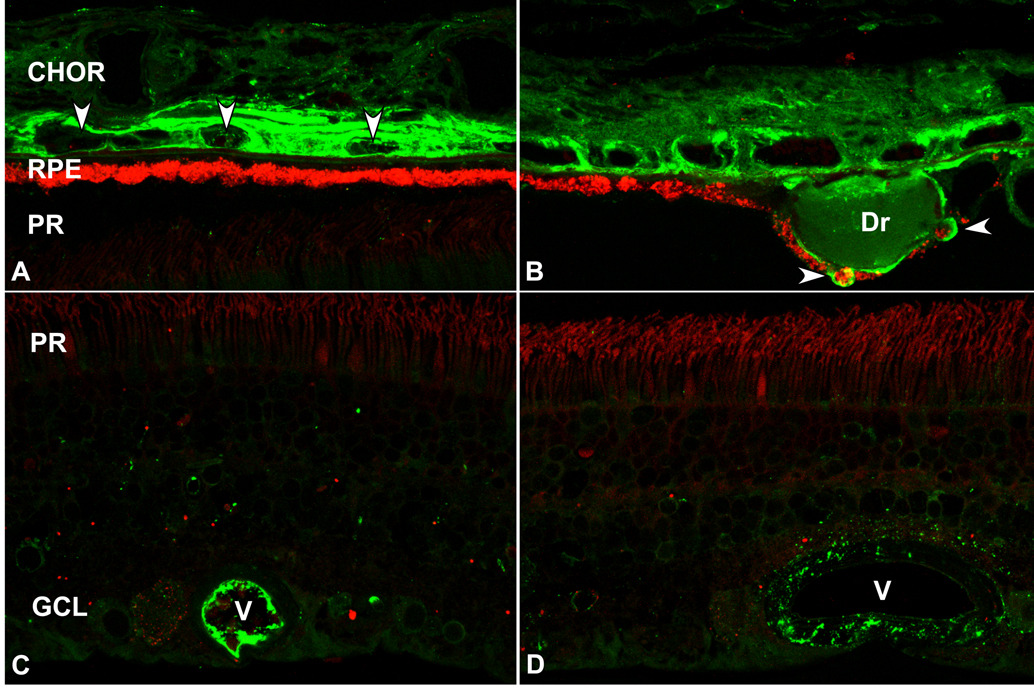
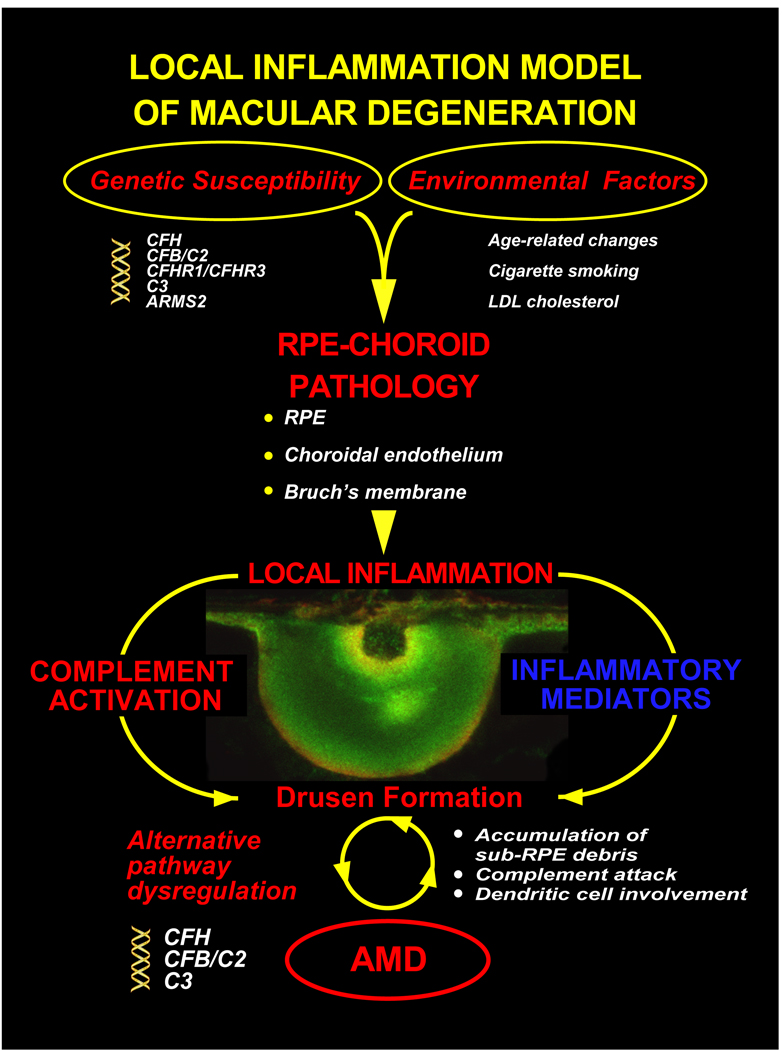
During the past ten years, dramatic advances have been made in unraveling the biological bases of age-related macular degeneration (AMD), the most common cause of irreversible blindness in western populations. In that timeframe, two distinct lines of evidence emerged which implicated chronic local inflammation and activation of the complement cascade in AMD pathogenesis. First, a number of complement system proteins, complement activators, and complement regulatory proteins were identified as molecular constituents of drusen, the hallmark extracellular deposits associated with early AMD. Subsequently, genetic studies revealed highly significant statistical associations between AMD and variants of several complement pathway-associated genes including: Complement factor H (CFH), complement factor H-related 1 and 3 (CFHR1 and CFHR3), complement factor B (CFB), complement component 2 (C2), and complement component 3 (C3). In this article, we revisit our original hypothesis that chronic local inflammatory and immune-mediated events at the level of Bruch's membrane play critical roles in drusen biogenesis and, by extension, in the pathobiology of AMD. Secondly, we report the results of a new screening for additional AMD-associated polymorphisms in a battery of 63 complement-related genes. Third, we identify and characterize the local complement system in the RPE-choroid complex - thus adding a new dimension of biological complexity to the role of the complement system in ocular aging and AMD. Finally, we evaluate the most salient, recent evidence that bears directly on the role of complement in AMD pathogenesis and progression. Collectively, these recent findings strongly re-affirm the importance of the complement system in AMD. They lay the groundwork for further studies that may lead to the identification of a transcriptional disease signature of AMD, and hasten the development of new therapeutic approaches that will restore the complement-modulating activity that appears to be compromised in genetically susceptible individuals.


Conflict of interest statement

Conflict of interest statement: GSH has a financial interest in Optherion, Inc., New Haven, CT

Figures

Figure 1
Figure 1
Schematic of the complement system. The complement cascade consists of 4 activation pathways, including the recently characterized intrinsic pathway, all of which converge upon a terminal pathway that results in the assembly of the membrane attack complex (MAC). Multiple complement regulatory proteins act at different levels to modulate the system. The complement components and regulatory molecues that are localized in drusen are highlighted by an asterisk.
Figure 2
Figure 2
Complement expression profiles of cells and tissues used in this study. The normalized expression values, as determined by real-time quantitative PCR, for all of the genes analyzed, are depicted graphically in the form of a pseudocolored heatmap. The numerical values can be found in Supplemental Table 3.
Figure 3
Figure 3
Real-time quantitative PCR analysis of gene expression in classical pathway-related genes. A-B. Expression profiles of classical pathway components (A) and regulators (B) in the RPE-choroid (dark blue), neural retina (red), and various tissue samples including: adult liver (yellow), fetal liver (pale yellow), lung (white), vein (orange),kidney (green), pooled kidney (light green), placenta (black), leukocytes (light blue) and whole blood (pink). Note off-scale expression levels of C1S (33.6) C2 (30.5), and SERPING1 (41.2) in adult liver. C. Expression profiles of classical pathway components and regulators (SERPING1, C4BPA) in microdissected tissue isolates. Choroid (blue), RPE (yellow), neural retina (red). D. Expression analysis of classical pathway components and regulators in cultured human cells. Fibroblasts (blue), RPE (yellow), HUVECs (white).
Figure 3
Figure 3
Real-time quantitative PCR analysis of gene expression in classical pathway-related genes. A-B. Expression profiles of classical pathway components (A) and regulators (B) in the RPE-choroid (dark blue), neural retina (red), and various tissue samples including: adult liver (yellow), fetal liver (pale yellow), lung (white), vein (orange),kidney (green), pooled kidney (light green), placenta (black), leukocytes (light blue) and whole blood (pink). Note off-scale expression levels of C1S (33.6) C2 (30.5), and SERPING1 (41.2) in adult liver. C. Expression profiles of classical pathway components and regulators (SERPING1, C4BPA) in microdissected tissue isolates. Choroid (blue), RPE (yellow), neural retina (red). D. Expression analysis of classical pathway components and regulators in cultured human cells. Fibroblasts (blue), RPE (yellow), HUVECs (white).
Figure 4
Figure 4
Real-time quantitative PCR analysis of gene expression in alternative pathway-related genes. A-B. Expression profiles of alternative pathway components (A) and regulators (B) in the same set of tissues shown in Figs. 1A-B. Note off-scale expression levels of CFB (21.6) in adult liver and MCP (23.2) in leukocytes. C-D. Expression profiles of alternative pathway components (C) and regulators (D) in tissue isolates. Choroid (blue), RPE (yellow), retina (red). E-F. Expression levels of alternative pathway components (E) and regulators (F) in cultured human fibroblasts (blue), RPE (yellow), and HUVECs (white). Note the relatively low levels of alternative pathway component expression in the cultured cells (E) relative to the intact choroids (C).
Figure 5
Figure 5
Real-time quantitative PCR analysis of gene expression in terminal pathway-related genes. A-B. Expression profile of terminal pathway components (A) and regulators (B) using the same set of tissues/cells described above in Figs. 2A-B. A. Expression of most terminal pathway components was low in the RPE-choroid and neural retina, with the exception of C7 where levels were 1.9±0.3 (N=13) and 0.18±0.09 (N=5) respectively. Note the off-scale expression levels of C7 in lung (12.6) and C8G in adult liver (28.0). B. Expression profiles of the three terminal regulators (CLU, CD59, VTN). CLU expression levels were relatively high in both in the RPE-choroid (7.72±0.68; N=13) and neural retina (3.28±0.57; N=8) relative to adult liver. Levels of CD59 in the RPE-choroid (1.6±0.47; N=12) were also comparable to those in adult liver. In contrast, VTN expression in retina and RPE-choroid was over 10 fold lower than in adult liver, with much higher levels in the neural retina (1.29±0.15; N=12) than in the RPE-choroid (0.19+0.05* N=13). C-D. C3 and terminal pathway-related expression profiles in isolated choroids (blue), RPE (yellow), and neural retina (red). C. In the isolated choroid, robust expression of C3, C7, and, to a lesser extent, C5 was evident. In contrast, there was little or no evidence of C3 or terminal pathway component expression in either isolated neural retina or RPE. D. Expression levels of CLU and VTN expression were highest in the isolated RPE, and somewhat lower in neural retina and choroid. Levels of CD59 were highest in the choroid and extremely low in the neural retina and RPE. E-F. Terminal pathway-related expression in cultured human fibroblasts blue), RPE cells (yellow), and HUVECs (white). E. As in the isolated tissues (C), expression in the cultured cells was limited to C3, C5, and C7; overall expression levels in the cultured cells were considerably lower than in the isolated tissues. F. CD59 expression levels were highest in HUVECs, whereas levels of CLU were highest in the RPE cells.
Figure 6
Figure 6
Localization of alternative pathway components and inhibitors in human RPE, choroid (CHOR), and retina (RET) by confocal immunofluorescence microscopy. A. Albumin immunoreactivity is distributed throughout the choroid (CY2; green). Lipofuscin autofluorescence is present in the RPE cytoplasm (CY3; red) B. Factor H is localized to choroidal capillaries and the intercapillary pillars (arrowhead) (CY2; green). Lipofuscin autofluorescence (CY5; blue), C-reactive protein (CY3; red). C-D. MCP (CD46) is localized to choroidal vessel walls (arrowhead) and to the basolateral surface of the RPE (arrow). Photoreceptor layer of the retina (PH) (CY2; green). The polarized basolateral distribution of MCP is preserved in cultured human fetal RPE cells (shown in D) (CY2; green). RPE cell nuclei are stained by the DNA binding dye Hoescht 33258 (violet) (D). E. DAF (CD55) immunoreactivity is associated with choroidal vessel walls, but absent in the RPE and in drusen arrows) (CY2; green). F-G. Factor B/C5b-9 co-localization [anti-Factor B (CY2, green); anti-C5b-9 (CY3, red)]. Diffuse anti-Factor B labeling is present throughout the choroid; choroidal capillary vessel walls are heavily labeled (arrowhead). Factor B immunofluorescence can be localized to the cores of some drusen (Dr). H. Factor I localization (CY2, green). Lipofuscin autofluorescence is visualized on the CY3 channel (red). Most Factor I immunoreactivity is concentrated in the inner retina (RET) and, to a lesser extent, in the choroid. I. Factor D adipsin) localization (CY2, green). Lipofuscin autofluorescence (CY3, red). Diffuse Factor D immunoreactivity is present throughout the retina and choroid.
Figure 7
Figure 7
Localization of complement C3 in human RPE, choroid (CHOR), and neural retina by confocal immunofluorescence microscopy. A-B. C3 immunoreactivity is concentrated in the RPE-choroid, but absent in the photoreceptor layer (PR) of the neural retina (CY2, green). Lipofuscin autofluorescence (CY3, red). A. Intense C3 immunofluorescence is associated with the microvasculature in the choroid. Arrowheads indicate cross-sections of choroidal capillaries. B. In those eyes with drusen (Dr), C3 immunoreactivity is also present in the extracellular space between the RPE and Bruch’s membrane (i.e. the sub-RPE space) and in the cytoplasm of some RPE cells (arrowheads) overlying drusen. C-D. Localization of C3 in the retina (CY2, green). C3 immunoreactivity is confined to the lumens and walls of blood vessels (V) in the inner retina.
Figure 8
Figure 8
Inflammation model of macular degeneration (updated from Anderson et al, 2002). According to the model, AMD may triggered by one or more environmental risk factors (see text) that occurs against the background of a genetic susceptibility profile conferred by variants in the CFH, CFB/C2, and/or C3 gene triad (The potential role of the ARMS2 locus in the inflammatory process, if any, remains to be clarified). This confluence of environmental and genetic risk factors gives rise to pathological changes in the RPE-choroid late in life which generates a chronic, local inflammatory response that includes complement activation and other inflammation-mediated events characterized, in part, by alterations in Bruch’s membrane, drusen formation and the accumulation of other sub-RPE deposits, bystander cell lysis, and dendritic cell involvement. Over time, these processes/events result in photoreceptor degeneration and the loss of central vision that defines the clinical entity of AMD.

Similar articles

Cited by

References

    1. Allikmets R, Dean M, Hageman GS, Baird PN, Klaver CC, Bergen AA, Weber BH. The SERPING1 gene and age-related macular degeneration. Lancet. 2009;374:875–876. author reply 876-7. - PMC - PubMed
    1. Anderson DH, Mullins RF, Hageman GS, Johnson LV. A role for local inflammation in the formation of drusen in the aging eye. Am J Ophthalmol. 2002;134:411–431. - PubMed
    1. Anderson DH, Talaga KC, Rivest AJ, Barron E, Hageman GS, Johnson LV. Characterization of beta amyloid assemblies in drusen: the deposits associated with aging and age-related macular degeneration. Exp Eye Res. 2004;78:243–256. - PubMed
    1. Bergeron-Sawitzke J, Gold B, Olsh A, Schlotterbeck S, Lemon K, Visvanathan K, Allikmets R, Dean M. Multilocus analysis of age-related macular degeneration. Eur J Hum Genet. 2009 - PMC - PubMed
    1. Black S, Kushner I, Samols D. C-reactive Protein. J Biol Chem. 2004;279:48487–48490. - PubMed

Publication types

MeSH terms

Substances