Randomized Controlled Trial
. 2010 Apr;125(4):889-895.e7.
doi: 10.1016/j.jaci.2009.09.012. Epub 2009 Dec 4.

Effects of omalizumab on basophil and mast cell responses using an intranasal cat allergen challenge

Affiliations
Randomized Controlled Trial

Effects of omalizumab on basophil and mast cell responses using an intranasal cat allergen challenge

John A Eckman et al. J Allergy Clin Immunol. 2010 Apr.

Abstract

Background: Omalizumab treatment suppresses FcepsilonRI expression faster on blood basophils than skin mast cells.

Objective: We used omalizumab to elucidate the relative contributions of basophil versus mast cell FcepsilonRI activation in a nasal allergen challenge (NAC) model.

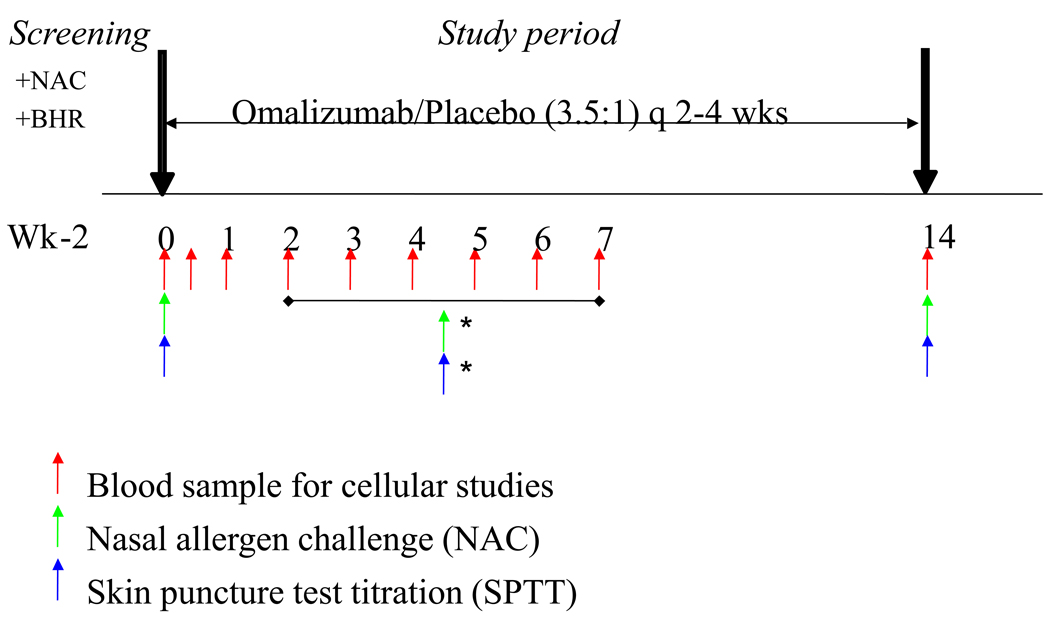
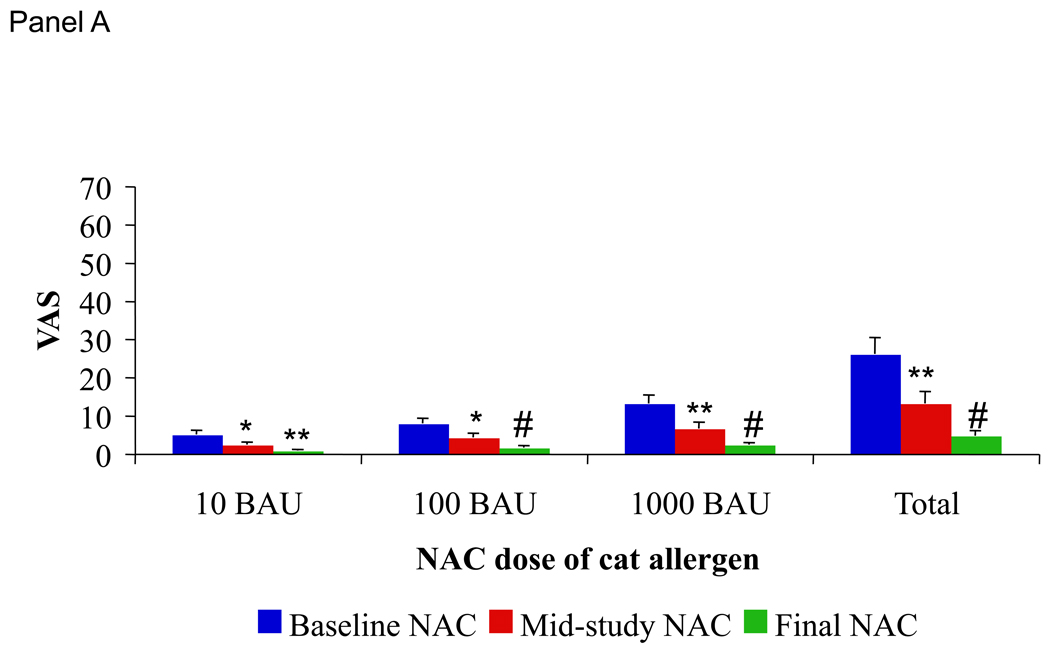
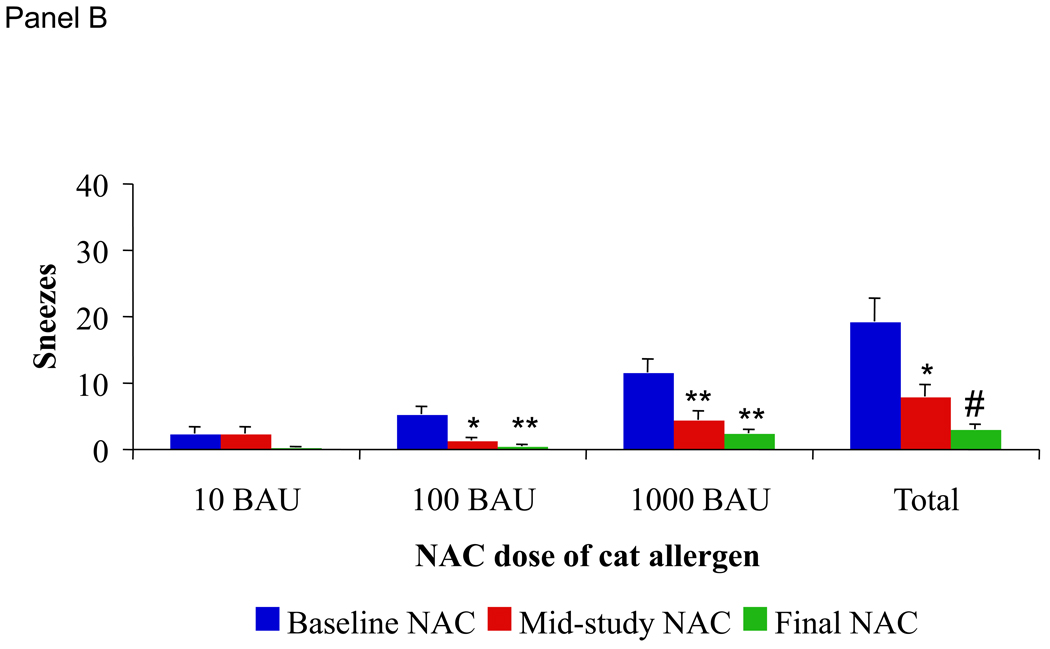
Methods: Eighteen subjects with cat allergy were enrolled in a 3.5-month, double-blind, randomized (3.5:1), placebo-controlled trial of omalizumab using standard dosing. At baseline, subjects underwent NAC with lavage for prostaglandin D(2) measurement, skin prick test titration (SPTT), and blood sampling for basophil histamine release (BHR) and basophil IgE/FcepsilonRI measurements. Basophil studies were repeated at day 3 and then weekly until cat allergen-induced BHR was <20% of baseline or until day 45. Baseline visit procedures were repeated after the BHR reduction (midstudy NAC) and at the treatment period's completion (final NAC).

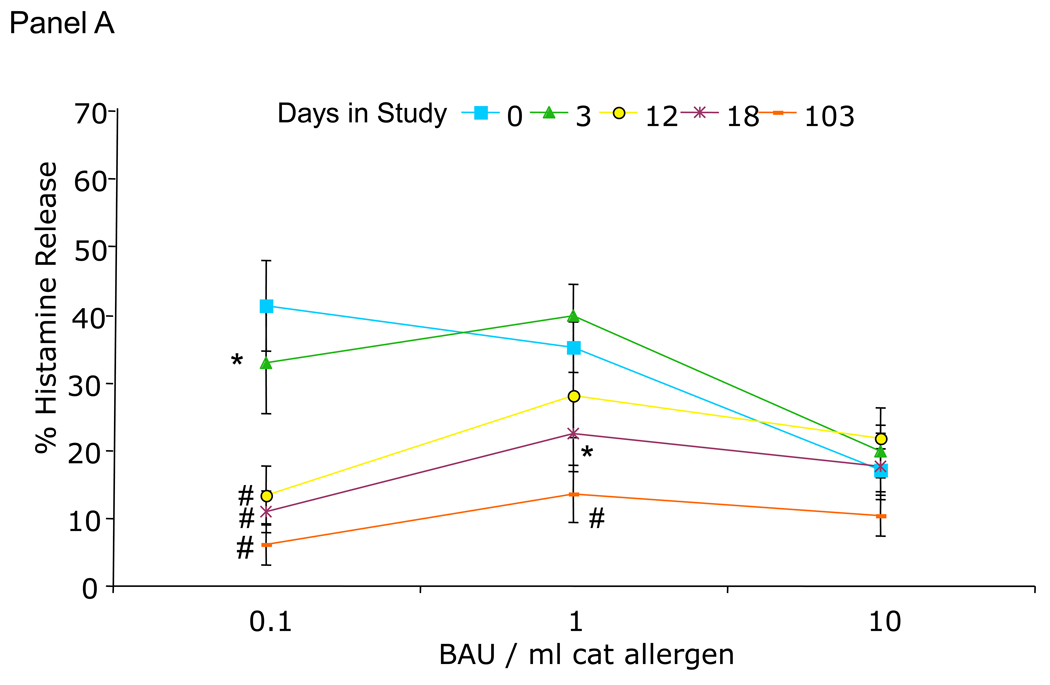
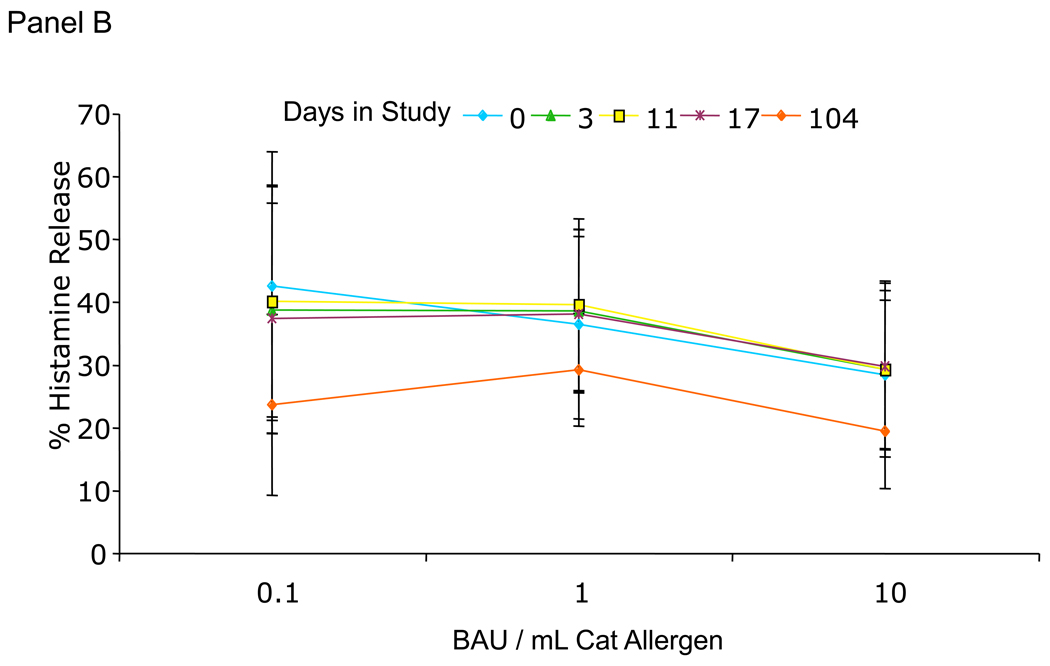
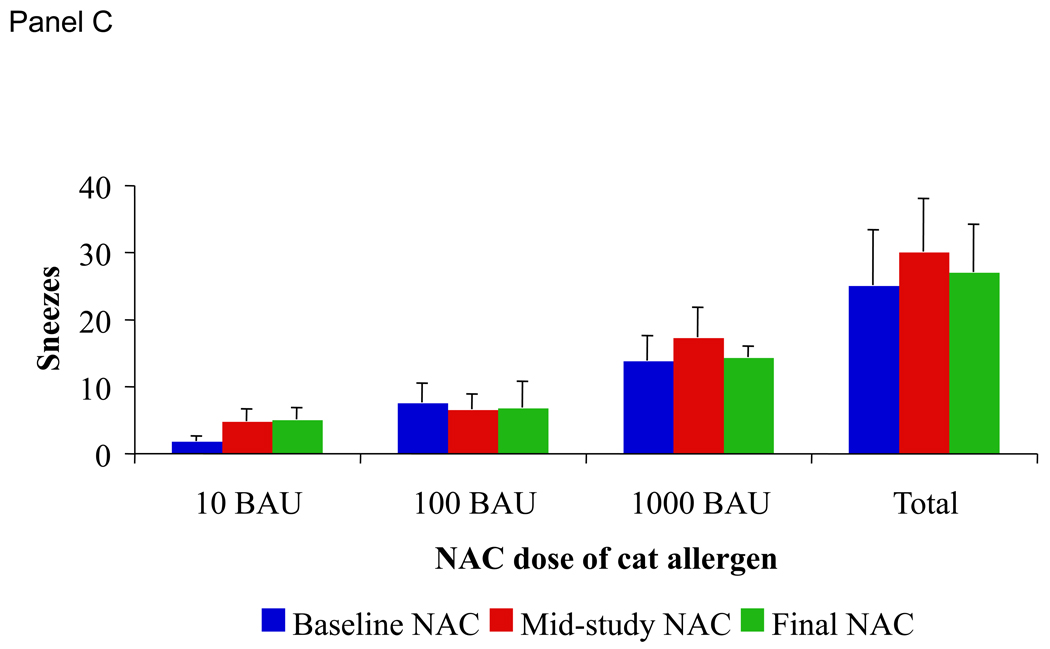
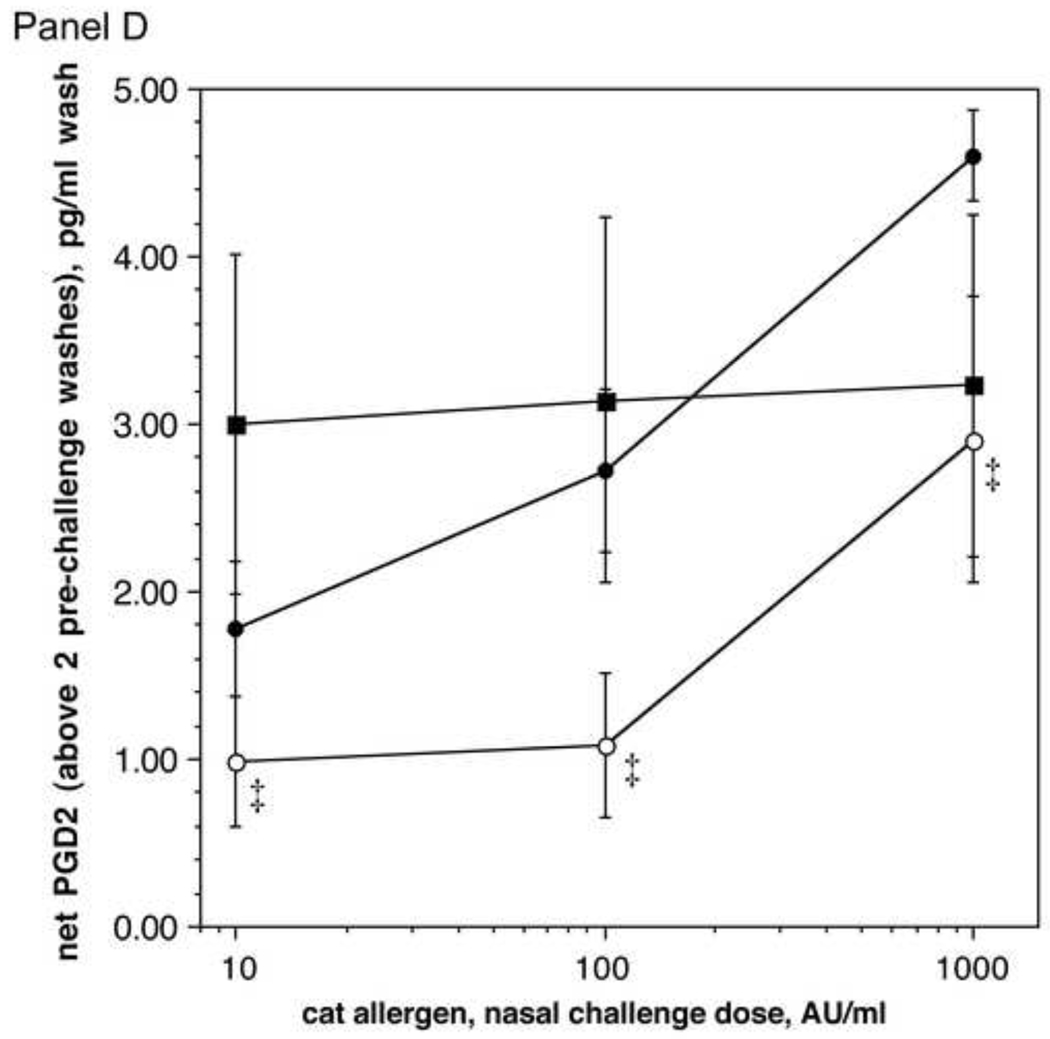
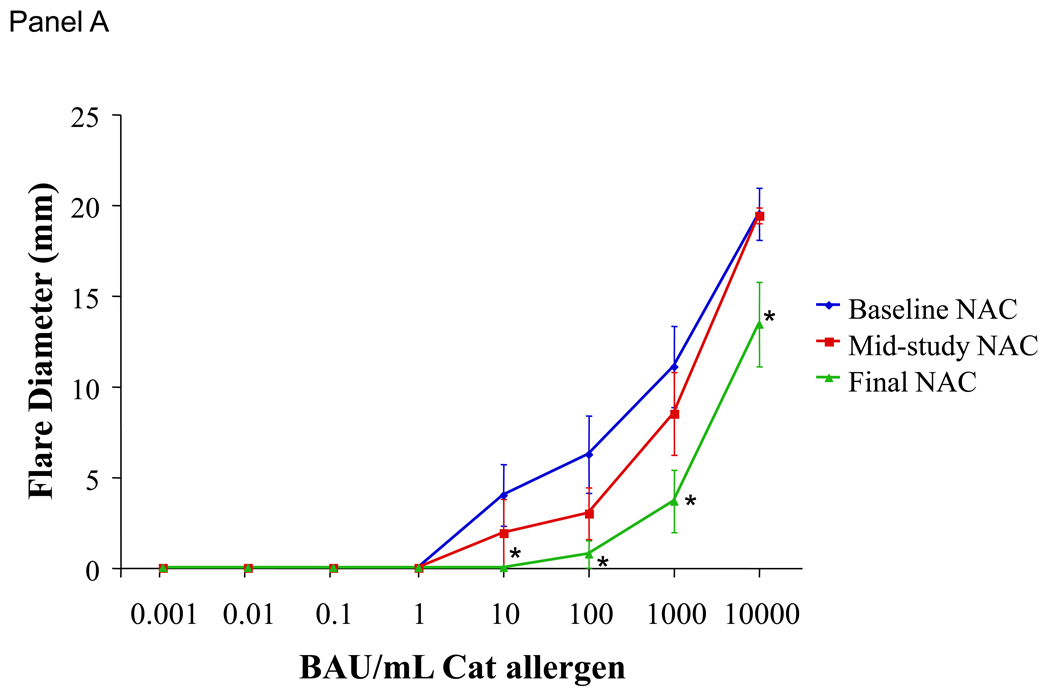
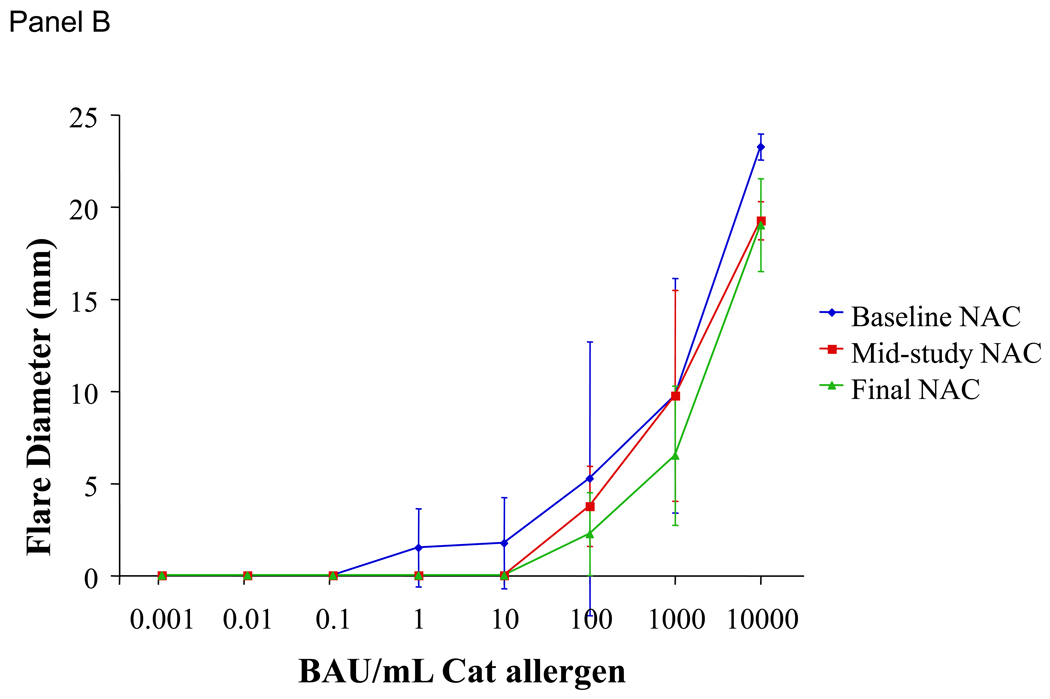
Results: Subjects treated with omalizumab who completed all NACs (n = 12) demonstrated significant mean reduction in BHR to an optimal dose of cat allergen by midstudy NAC compared with baseline (74% decrease; P = .001). In addition, these subjects demonstrated significant decreases in mean combined nasal symptom scores (50% decrease; P = .007) and total sneeze counts (59% decrease; P = .01) by midstudy NAC relative to baseline NAC. In contrast, measures of mast cell response (SPTT and nasal lavage prostaglandin D(2)) were only significantly reduced by the final NAC. Subjects on placebo (n = 4) did not experience a shift in basophil, NAC symptom, or mast cell measures.

Conclusion: Reduction in nasal symptom scores occurred when the basophil, but not mast cell, response was reduced on omalizumab, implicating a role for basophils in the acute NAC response.


Figures

Figure 1
Figure 1
Overall study design. *Mid-study NAC and SPTT occurred when cat allergen BHR is <20% of baseline or ~day 45.
Figure 2
Figure 2
Cat-allergen induced BHR. Cat-allergen induced basophil histamine response in omalizumab (Panel A, n=12) and placebo recipients (Panel B, n=4) relative to the day of study. All comparisons are within each group relative to relative to the response measured at baseline (day 0) by two-tailed paired t test. Error bars – S.E.M. *p<0.05, **p<0.01, #p<0.001, ‡p<0.0001
Figure 2
Figure 2
Cat-allergen induced BHR. Cat-allergen induced basophil histamine response in omalizumab (Panel A, n=12) and placebo recipients (Panel B, n=4) relative to the day of study. All comparisons are within each group relative to relative to the response measured at baseline (day 0) by two-tailed paired t test. Error bars – S.E.M. *p<0.05, **p<0.01, #p<0.001, ‡p<0.0001
Figure 3
Figure 3
The percent of cat-allergen specific IgE to total IgE is correlated to the timing of the mid-study NAC for subjects receiving omalizumab.
Figure 4
Figure 4
Average VAS score in omalizumab treated (Panel A, n=12) subjects grouped according to the dose of allergen and NAC visit. Average sneeze counts in omalizumab treated (Panel B, n=12) and placebo treated subjects (Panel C, n=4) grouped according to the dose of allergen and NAC visit. PGD2 levels in nasal lavage for each NAC allergen dose at the three NAC time points in actively treated subjects (Panel D, n=11). Baseline NAC – closed circles, Mid-study NAC – closed squares, Final NAC – open circles. . Error bars – S.E.M. *p<0.05, **p<0.01, #p<0.001, ‡p<0.0001
Figure 4
Figure 4
Average VAS score in omalizumab treated (Panel A, n=12) subjects grouped according to the dose of allergen and NAC visit. Average sneeze counts in omalizumab treated (Panel B, n=12) and placebo treated subjects (Panel C, n=4) grouped according to the dose of allergen and NAC visit. PGD2 levels in nasal lavage for each NAC allergen dose at the three NAC time points in actively treated subjects (Panel D, n=11). Baseline NAC – closed circles, Mid-study NAC – closed squares, Final NAC – open circles. . Error bars – S.E.M. *p<0.05, **p<0.01, #p<0.001, ‡p<0.0001
Figure 5
Figure 5
Average SPT flare size in omalizumab (n=12; Panel A) and placebo (n=4; Panel B) treated subjects at the time of indicated NAC. Error bars – S.E.M. *p<0.05, two-tailed, paired t test compared to baseline SPT value.
Figure 5
Figure 5
Average SPT flare size in omalizumab (n=12; Panel A) and placebo (n=4; Panel B) treated subjects at the time of indicated NAC. Error bars – S.E.M. *p<0.05, two-tailed, paired t test compared to baseline SPT value.

Similar articles

Cited by

References

    1. MacGlashan DW., Jr Therapeutic efficacy of omalizumab. J Allergy Clin Immunol. 2009;123:114–115. - PubMed
    1. Strunk RC, Bloomberg GR. Omalizumab for asthma. N Engl J Med. 2006;354:2689–2695. - PubMed
    1. Presta LG, Lahr SJ, Shields RL, Porter JP, Gorman CM, Fendly BM, et al. Humanization of an antibody directed against IgE. J Immunol. 1993;151:2623–2632. - PubMed
    1. Schulman ES. Development of a monoclonal anti-immunoglobulin E antibody (omalizumab) for the treatment of allergic respiratory disorders. Am J Respir Crit Care Med. 2001;164:S6–S11. - PubMed
    1. MacGlashan DW, Jr, Bochner BS, Adelman DC, Jardieu PM, Togias A, McKenzie-White J, et al. Down-regulation of Fc(epsilon)RI expression on human basophils during in vivo treatment of atopic patients with anti-IgE antibody. J Immunol. 1997;158:1438–1445. - PubMed

Publication types

MeSH terms