

Exposure to the synthetic FXR agonist GW4064 causes alterations in gene expression and sublethal hepatotoxicity in eleutheroembryo medaka (Oryzias latipes)
- PMID: 19963001
- PMCID: PMC2853180
- DOI: 10.1016/j.taap.2009.11.022
Exposure to the synthetic FXR agonist GW4064 causes alterations in gene expression and sublethal hepatotoxicity in eleutheroembryo medaka (Oryzias latipes)
Abstract
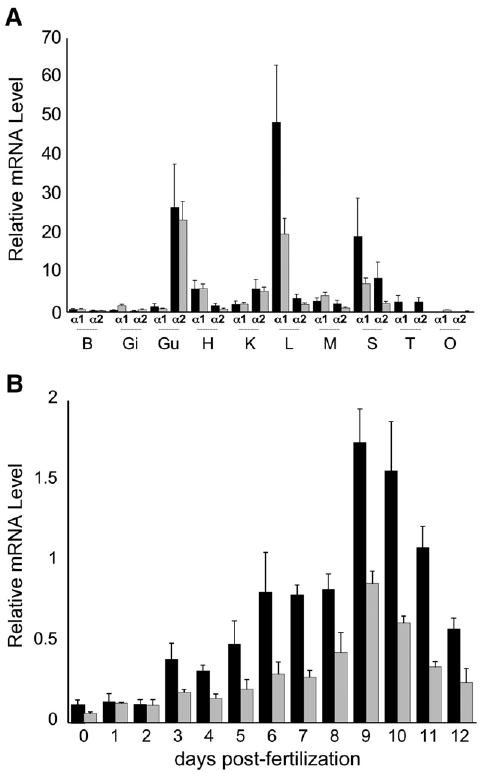
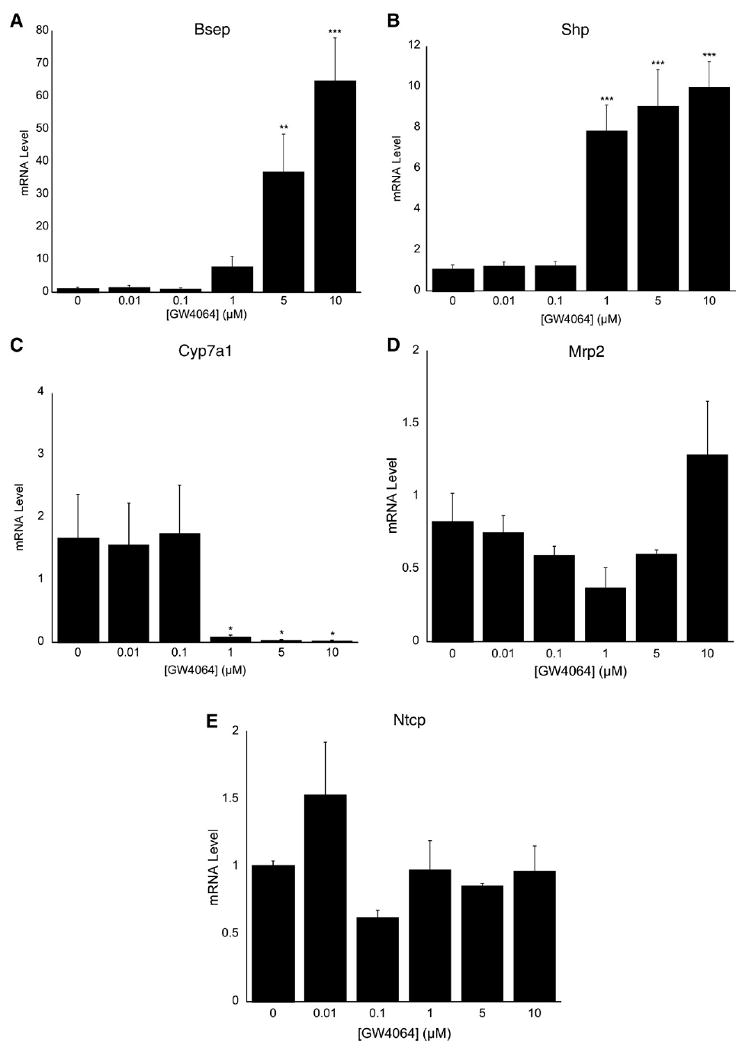
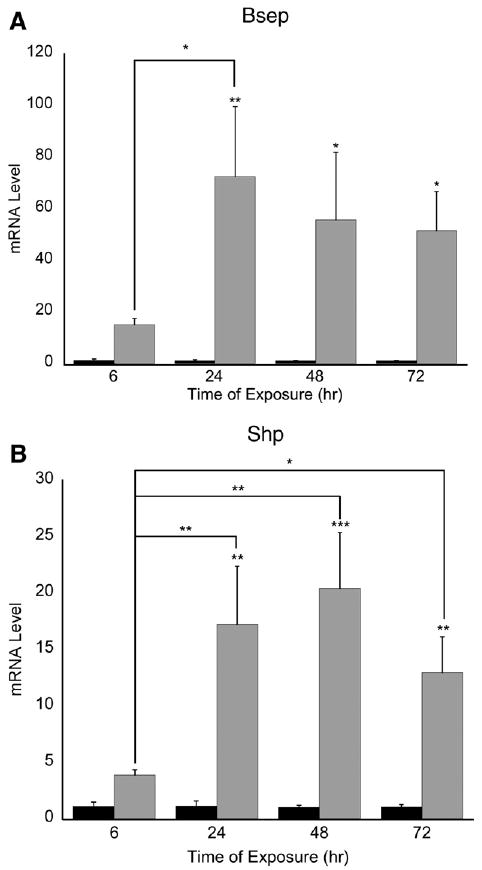
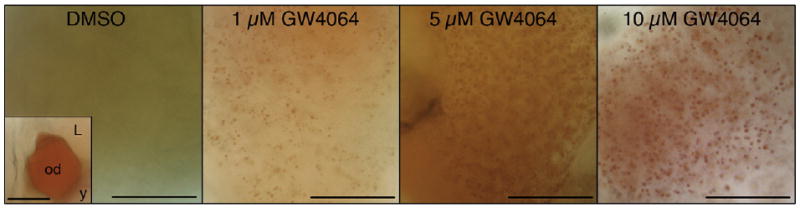
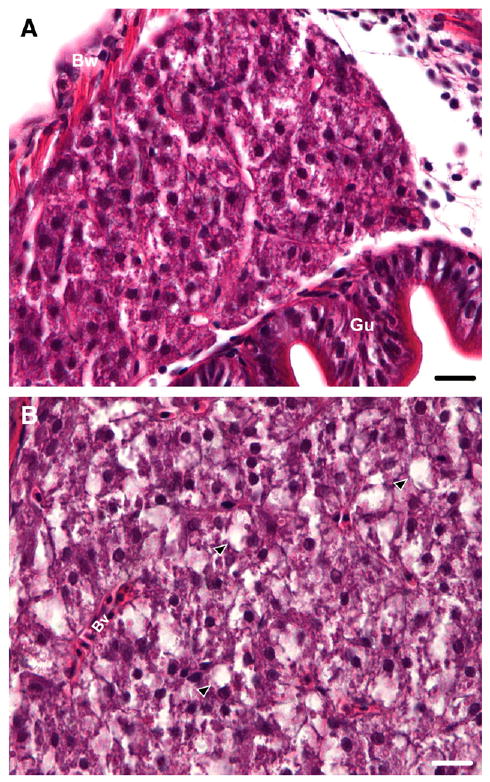
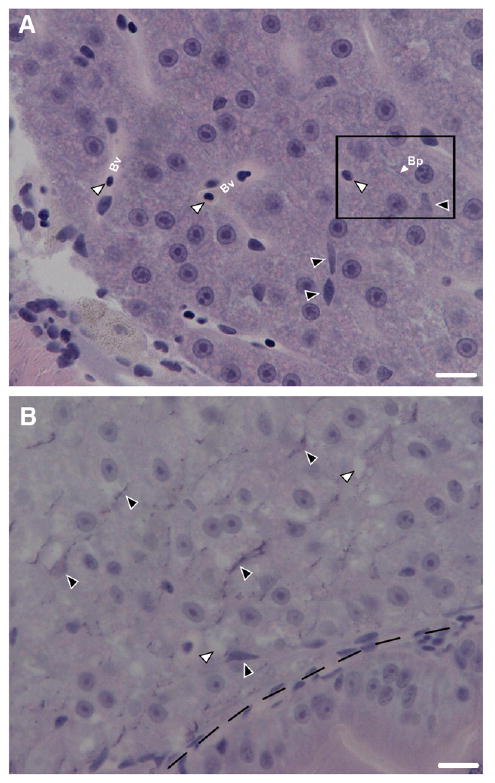
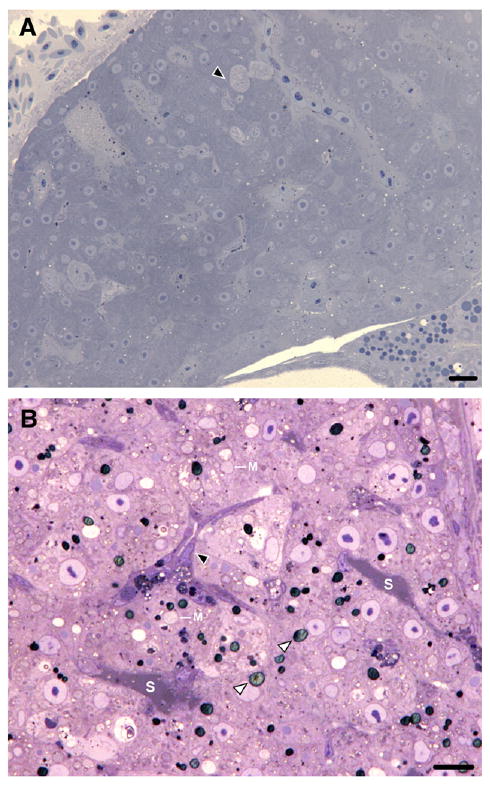
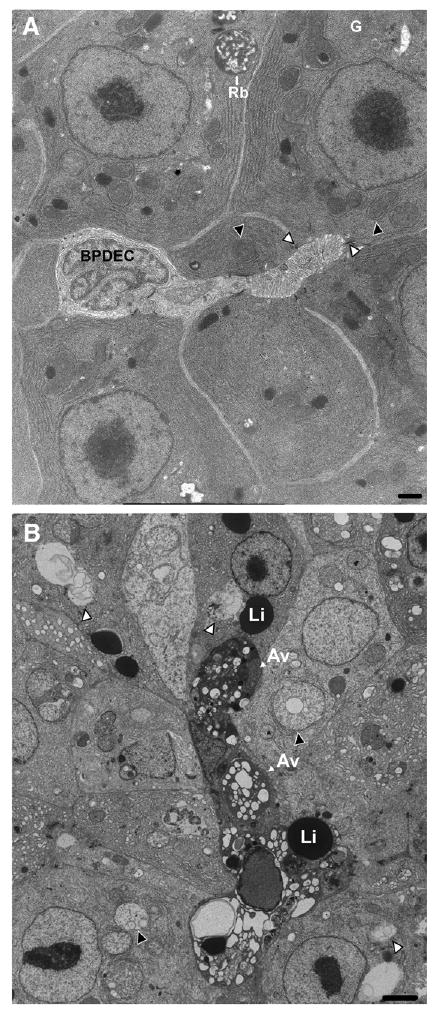
The small freshwater teleost, medaka (Oryzias latipes), has a history of usage in studies of chronic toxicity of liver and biliary system. Recent progress with this model has focused on defining the medaka hepatobiliary system. Here we investigate critical liver function and toxicity by examining the in vivo role and function of the farnesoid X receptor alpha (FXRalpha, NR1H4), a member of the nuclear receptor superfamily that plays an essential role in the regulation of bile acid homeostasis. Quantitative mRNA analysis of medaka FXRalpha demonstrates differential expression of two FXRalpha isoforms designated Fxralpha1 and Fxralpha2, in both free swimming medaka embryos with remaining yolk (eleutheroembryos, EEs) and adults. Activation of medaka Fxralpha in vivo with GW4064 (a strong FXRalpha agonist) resulted in modification of gene expression for defined FXRalpha gene targets including the bile salt export protein, small heterodimer partner, and cytochrome P450 7A1. Histological examination of medaka liver subsequent to GW4064 exposure demonstrated significant lipid accumulation, cellular and organelle alterations in both hepatocytes and biliary epithelial cells of the liver. This report of hepatobiliary injury following GW4064 exposure extends previous investigations of the intrahepatic biliary system in medaka, reveals sensitivity to toxicant exposure, and illustrates the need for added resolution in detection and interpretation of toxic responses in this vertebrate.
Copyright 2009 Elsevier Inc. All rights reserved.
Conflict of interest statement
Figures
Similar articles
-
Two farnesoid X receptor alpha isoforms in Japanese medaka (Oryzias latipes) are differentially activated in vitro.Aquat Toxicol. 2010 Jul 1;98(3):245-255. doi: 10.1016/j.aquatox.2010.02.020. Epub 2010 Mar 1. Aquat Toxicol. 2010. PMID: 20430454 Free PMC article.
-
Differential activation of the human farnesoid X receptor depends on the pattern of expressed isoforms and the bile acid pool composition.Biochem Pharmacol. 2013 Oct 1;86(7):926-39. doi: 10.1016/j.bcp.2013.07.022. Epub 2013 Aug 6. Biochem Pharmacol. 2013. PMID: 23928191
-
Pharmacologic activation of hepatic farnesoid X receptor prevents parenteral nutrition-associated cholestasis in mice.Hepatology. 2022 Feb;75(2):252-265. doi: 10.1002/hep.32101. Epub 2021 Dec 7. Hepatology. 2022. PMID: 34387888
-
FXR agonist GW4064 improves liver and intestinal pathology and alters bile acid metabolism in rats undergoing small intestinal resection.Am J Physiol Gastrointest Liver Physiol. 2019 Aug 1;317(2):G108-G115. doi: 10.1152/ajpgi.00356.2017. Epub 2019 Mar 28. Am J Physiol Gastrointest Liver Physiol. 2019. PMID: 30920307
-
GW4064, an agonist of farnesoid X receptor, represses CYP3A4 expression in human hepatocytes by inducing small heterodimer partner expression.Drug Metab Dispos. 2015 May;43(5):743-8. doi: 10.1124/dmd.114.062836. Epub 2015 Feb 27. Drug Metab Dispos. 2015. PMID: 25725071 Free PMC article.
Cited by
-
Two farnesoid X receptor alpha isoforms in Japanese medaka (Oryzias latipes) are differentially activated in vitro.Aquat Toxicol. 2010 Jul 1;98(3):245-255. doi: 10.1016/j.aquatox.2010.02.020. Epub 2010 Mar 1. Aquat Toxicol. 2010. PMID: 20430454 Free PMC article.
-
Pharmacophore modeling and virtual screening studies for discovery of novel farnesoid X receptor (FXR) agonists.RSC Adv. 2021 Jan 7;11(4):2158-2166. doi: 10.1039/d0ra09320c. eCollection 2021 Jan 6. RSC Adv. 2021. PMID: 35424145 Free PMC article.
-
FXR, a Key Regulator of Lipid Metabolism, Is Inhibited by ER Stress-Mediated Activation of JNK and p38 MAPK in Large Yellow Croakers (Larimichthys crocea) Fed High Fat Diets.Nutrients. 2021 Dec 1;13(12):4343. doi: 10.3390/nu13124343. Nutrients. 2021. PMID: 34959897 Free PMC article.
-
Dose-related liver injury of Geniposide associated with the alteration in bile acid synthesis and transportation.Sci Rep. 2017 Aug 21;7(1):8938. doi: 10.1038/s41598-017-09131-2. Sci Rep. 2017. PMID: 28827769 Free PMC article.
-
Protective effects of calycosin against CCl4-induced liver injury with activation of FXR and STAT3 in mice.Pharm Res. 2015 Feb;32(2):538-48. doi: 10.1007/s11095-014-1483-3. Epub 2014 Aug 21. Pharm Res. 2015. PMID: 25143196
References
-
- Akwabi-Ameyaw A, Bass JY, et al. Conformationally constrained farnesoid X receptor (FXR) agonists: naphthoic acid-based analogs of GW 4064. Bioorg Med Chem Lett. 2008;18(15):4339–4343. - PubMed
-
- Bass JY, Caldwell RD, et al. Substituted isoxazole analogs of farnesoid X receptor (FXR) agonist GW4064. Bioorg Med Chem Lett. 2009;19(11):2969–2973. - PubMed
-
- Cai SY, Xiong L, et al. The farnesoid X receptor, FXR{alpha}/NR1H4, acquired ligand specificity for bile salts late in vertebrate evolution. Am J Physiol Regul Integr Comp Physiol. 2007;293(3):R1400–R1409. - PubMed
-
- Cariou B, van Harmelen K, et al. The farnesoid X receptor modulates adiposity and peripheral insulin sensitivity in mice. J Biol Chem. 2006;281(16):11039–11049. - PubMed
Publication types
MeSH terms
Substances
Grants and funding
LinkOut - more resources
Full Text Sources
Other Literature Sources
Medical
Research Materials
