Sound localization cues in the marmoset monkey
- PMID: 19963054
- PMCID: PMC2819082
- DOI: 10.1016/j.heares.2009.12.001
Sound localization cues in the marmoset monkey
Abstract
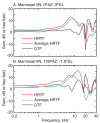
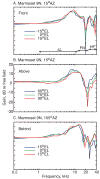
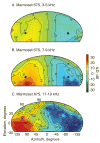
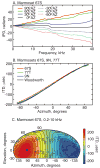
The most important acoustic cues available to the brain for sound localization are produced by the interaction of sound with the animal's head and external ears. As a first step in understanding the relation between these cues and their neural representation in a vocal new-world primate, we measured head-related transfer functions (HRTFs) across frequency for a wide range of sound locations in three anesthetized marmoset monkeys. The HRTF magnitude spectrum has a broad resonance peak at 6-12 kHz that coincides with the frequency range of the major call types of this species. A prominent first spectral notch (FN) in the HRTF magnitude above this resonance was observed at most source locations. The center frequency of the FN increased monotonically from approximately 12 to 26 kHz with increases in elevation in the lateral field. In the frontal field FN frequency changed in a less orderly fashion with source position. From the HRTFs we derived interaural time (ITDs) and level differences (ILDs). ITDs and ILDs (below 12 kHz) varied as a function of azimuth between +/-250 micros and +/-20dB, respectively. A reflexive orienting behavioral paradigm was used to confirm that marmosets can orient to sound sources.
Published by Elsevier B.V.
Figures






Similar articles
-
Head-related transfer functions of rabbits within the front horizontal plane.Hear Res. 2024 Jan;441:108924. doi: 10.1016/j.heares.2023.108924. Epub 2023 Dec 2. Hear Res. 2024. PMID: 38061267 Free PMC article.
-
Sound pressure transformations by the head and pinnae of the adult Chinchilla (Chinchilla lanigera).Hear Res. 2011 Feb;272(1-2):135-47. doi: 10.1016/j.heares.2010.10.007. Epub 2010 Oct 27. Hear Res. 2011. PMID: 20971180 Free PMC article.
-
Head-related transfer functions of the Rhesus monkey.Hear Res. 2000 Jun;144(1-2):73-88. doi: 10.1016/s0378-5955(00)00050-2. Hear Res. 2000. PMID: 10831867
-
Sound localization.Handb Clin Neurol. 2015;129:99-116. doi: 10.1016/B978-0-444-62630-1.00006-8. Handb Clin Neurol. 2015. PMID: 25726265 Review.
-
[Sound localization cues of binaural hearing].Laryngorhinootologie. 2003 Apr;82(4):240-8. doi: 10.1055/s-2003-38932. Laryngorhinootologie. 2003. PMID: 12717598 Review. German.
Cited by
-
Gaze shifts to auditory and visual stimuli in cats.J Assoc Res Otolaryngol. 2013 Oct;14(5):731-55. doi: 10.1007/s10162-013-0401-4. Epub 2013 Jun 8. J Assoc Res Otolaryngol. 2013. PMID: 23749194 Free PMC article.
-
Frequency discrimination in the common marmoset (Callithrix jacchus).Hear Res. 2016 Nov;341:1-8. doi: 10.1016/j.heares.2016.07.006. Epub 2016 Aug 3. Hear Res. 2016. PMID: 27498400 Free PMC article.
-
Sound localization in barn owls studied with manipulated head-related transfer functions: beyond broadband interaural time and level differences.J Comp Physiol A Neuroethol Sens Neural Behav Physiol. 2020 Jul;206(4):477-498. doi: 10.1007/s00359-020-01410-0. Epub 2020 Mar 5. J Comp Physiol A Neuroethol Sens Neural Behav Physiol. 2020. PMID: 32140774
-
Hearing ability of prairie voles (Microtus ochrogaster).J Acoust Soc Am. 2024 Jan 1;155(1):555-567. doi: 10.1121/10.0024357. J Acoust Soc Am. 2024. PMID: 38259128 Free PMC article.
-
Concurrent development of the head and pinnae and the acoustical cues to sound location in a precocious species, the chinchilla (Chinchilla lanigera).J Assoc Res Otolaryngol. 2011 Apr;12(2):127-40. doi: 10.1007/s10162-010-0242-3. Epub 2010 Oct 19. J Assoc Res Otolaryngol. 2011. PMID: 20957506 Free PMC article.
References
-
- Aitkin L, Park V. Audition and the auditory pathway of a vocal New World primate, the common marmoset. Prog Neurobiol. 1993;41(3):345–67. - PubMed
-
- Aytekin M, Grassi E, et al. The bat head-related transfer function reveals binaural cues for sound localization in azimuth and elevation. J Acoust Soc Am. 2004;116(6):3594–605. - PubMed
-
- Bartlett EL, Wang X. Neural representations of temporally modulated signals in the auditory thalamus of awake primates. J Neurophysiol. 2007;97(2):1005–17. - PubMed
-
- Blauert J. Spatial hearing. Cambridge: MIT; 1997.
Publication types
MeSH terms
Grants and funding
LinkOut - more resources
Full Text Sources
Other Literature Sources
Research Materials
Miscellaneous

