

Conformation and dynamics of biopharmaceuticals: transition of mass spectrometry-based tools from academe to industry
- PMID: 19963397
- PMCID: PMC2827695
- DOI: 10.1016/j.jasms.2009.10.013
Conformation and dynamics of biopharmaceuticals: transition of mass spectrometry-based tools from academe to industry
Abstract
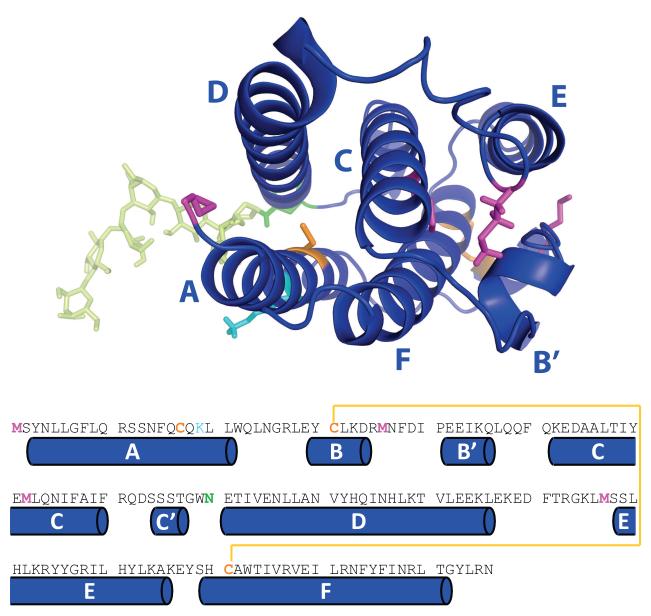
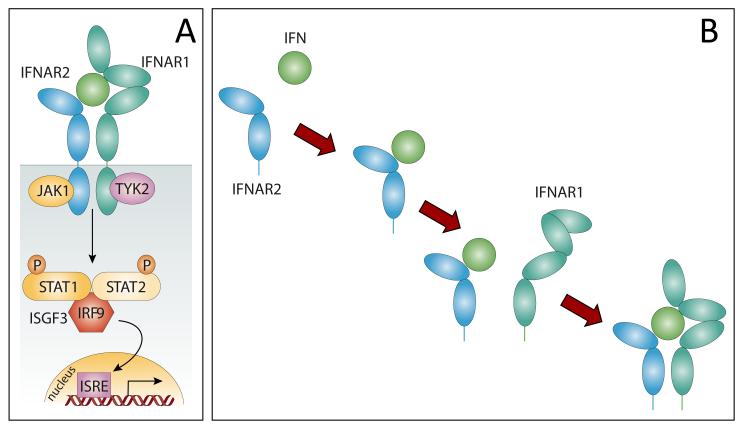
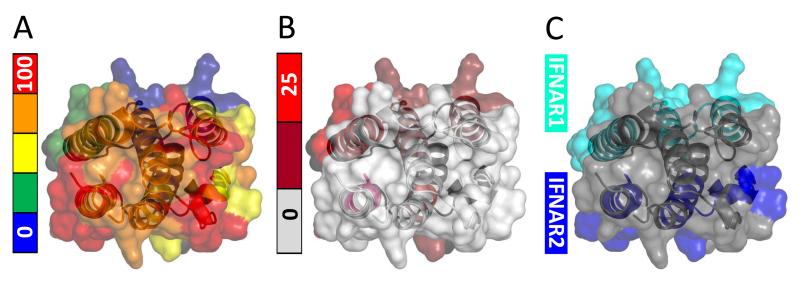
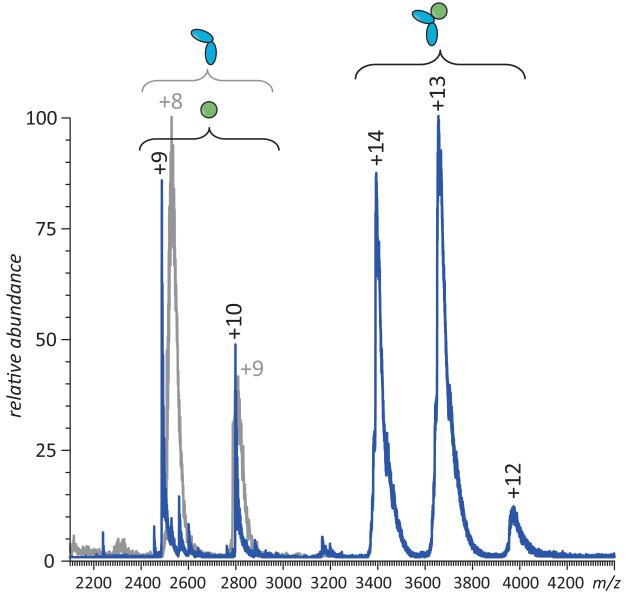
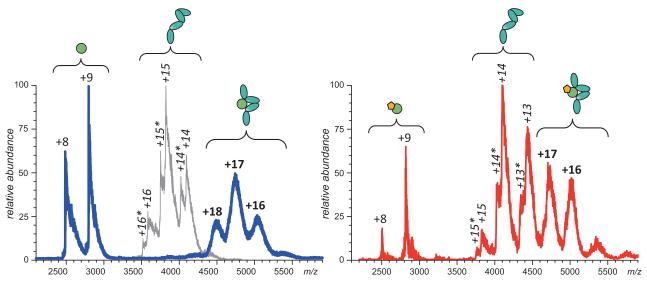
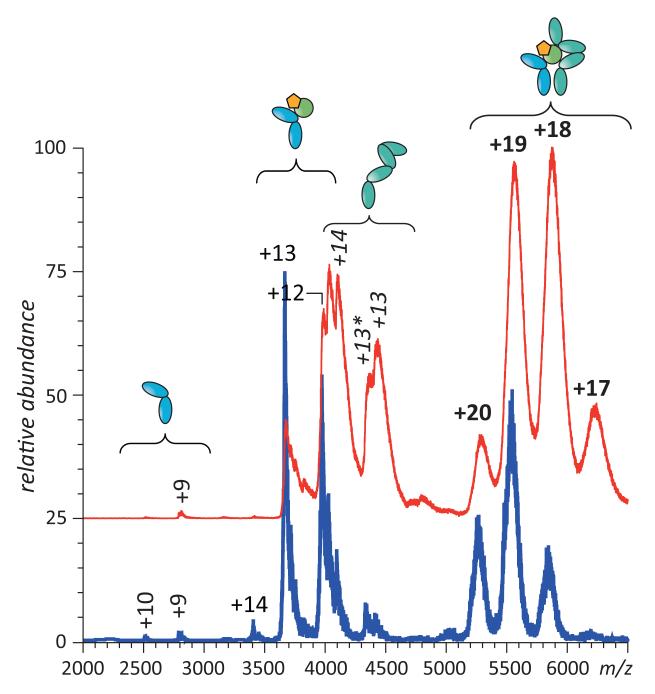
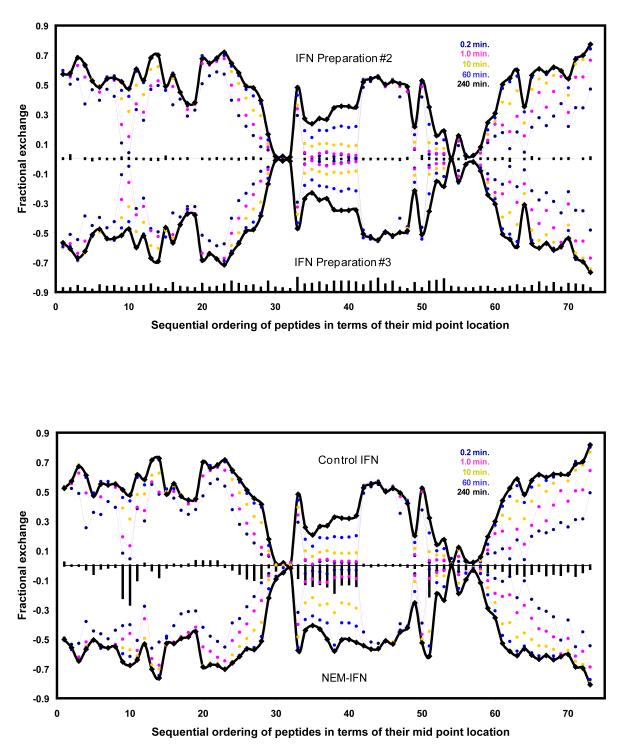
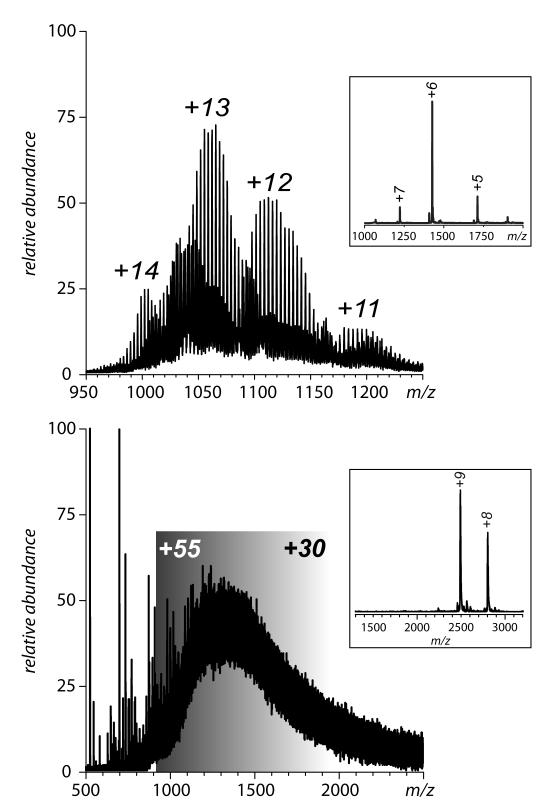
Mass spectrometry plays a very visible role in biopharmaceutical industry, although its use in development, characterization, and quality control of protein drugs is mostly limited to the analysis of covalent structure (amino acid sequence and post-translational modifications). Despite the centrality of protein conformation to biological activity, stability, and safety of biopharmaceutical products, the expanding arsenal of mass spectrometry-based methods that are currently available to probe higher order structure and conformational dynamics of biopolymers did not, until recently, enjoy much attention in the industry. This is beginning to change as a result of recent work demonstrating the utility of these experimental tools for various aspects of biopharmaceutical product development and manufacturing. In this work, we use a paradigmatic protein drug interferon beta-1a as an example to illustrate the utility of mass spectrometry as a powerful tool not only to assess the integrity of higher order structure of a protein drug, but also to predict consequences of its degradation at a variety of levels.
Copyright 2010 American Society for Mass Spectrometry. Published by Elsevier Inc. All rights reserved.
Figures
Similar articles
-
Advanced mass spectrometry-based methods for the analysis of conformational integrity of biopharmaceutical products.Curr Pharm Biotechnol. 2011 Oct;12(10):1517-29. doi: 10.2174/138920111798357311. Curr Pharm Biotechnol. 2011. PMID: 21542797 Free PMC article. Review.
-
Mass spectrometry-based methods in characterization of the higher order structure of protein therapeutics.J Pharm Biomed Anal. 2020 May 30;184:113169. doi: 10.1016/j.jpba.2020.113169. Epub 2020 Feb 12. J Pharm Biomed Anal. 2020. PMID: 32092629 Free PMC article. Review.
-
Detection and characterization of altered conformations of protein pharmaceuticals using complementary mass spectrometry-based approaches.Anal Chem. 2008 Oct 1;80(19):7473-81. doi: 10.1021/ac801214x. Epub 2008 Aug 27. Anal Chem. 2008. PMID: 18729476 Free PMC article.
-
Biopharmaceutical quality control with mass spectrometry.Bioanalysis. 2021 Aug;13(16):1275-1291. doi: 10.4155/bio-2021-0123. Epub 2021 Aug 31. Bioanalysis. 2021. PMID: 34463131 Review.
-
Advances and challenges in analytical characterization of biotechnology products: mass spectrometry-based approaches to study properties and behavior of protein therapeutics.Biotechnol Adv. 2012 Jan-Feb;30(1):210-22. doi: 10.1016/j.biotechadv.2011.05.006. Epub 2011 May 17. Biotechnol Adv. 2012. PMID: 21619926 Free PMC article. Review.
Cited by
-
Isotope Labeling of Biomolecules: Structural Analysis of Viruses by HDX-MS.Methods Enzymol. 2016;566:405-26. doi: 10.1016/bs.mie.2015.05.021. Epub 2015 Jul 4. Methods Enzymol. 2016. PMID: 26791988 Free PMC article.
-
Basic regulatory science behind drug substance and drug product specifications of monoclonal antibodies and other protein therapeutics.J Pharm Anal. 2024 Jun;14(6):100916. doi: 10.1016/j.jpha.2023.12.006. Epub 2023 Dec 10. J Pharm Anal. 2024. PMID: 39035218 Free PMC article. Review.
-
Advanced mass spectrometry-based methods for the analysis of conformational integrity of biopharmaceutical products.Curr Pharm Biotechnol. 2011 Oct;12(10):1517-29. doi: 10.2174/138920111798357311. Curr Pharm Biotechnol. 2011. PMID: 21542797 Free PMC article. Review.
-
Top-down mass spectrometry: recent developments, applications and perspectives.Analyst. 2011 Oct 7;136(19):3854-64. doi: 10.1039/c1an15286f. Epub 2011 Aug 8. Analyst. 2011. PMID: 21826297 Free PMC article. Review.
-
Enhancing the quality of H/D exchange measurements with mass spectrometry detection in disulfide-rich proteins using electron capture dissociation.Anal Chem. 2014 Jun 3;86(11):5225-31. doi: 10.1021/ac500904p. Epub 2014 May 22. Anal Chem. 2014. PMID: 24820935 Free PMC article.
References
-
- Knäblein J, editor. Modern Biopharmaceuticals: Design, Development and Optimization. Vol. 1-4. WILEY-VCH Verlag GmbH & Co.; Weinheim: 2005.
-
- Volpi N. Therapeutic applications of glycosaminoglycans. Curr. Med. Chem. 2006;13:1799–1810. - PubMed
-
- Alvarez-Salas LM. Nucleic Acids as Therapeutic Agents. Curr. Top. Med. Chem. 2008;8:1379–1404. - PubMed
-
- Spada S, Walsh G. Directory of approved biopharmaceutical products. CRC Press; Boca Raton: 2005.
-
- Leader B, Baca QJ, Golan DE. Protein therapeutics: a summary and pharmacological classification. Nat. Rev. Drug Discov. 2008;7:21–39. - PubMed
Publication types
MeSH terms
Substances
Grants and funding
LinkOut - more resources
Full Text Sources
Other Literature Sources
