

3D (13)C-(13)C-(13)C correlation NMR for de novo distance determination of solid proteins and application to a human alpha-defensin
- PMID: 19963419
- PMCID: PMC2819753
- DOI: 10.1016/j.jmr.2009.11.011
3D (13)C-(13)C-(13)C correlation NMR for de novo distance determination of solid proteins and application to a human alpha-defensin
Abstract
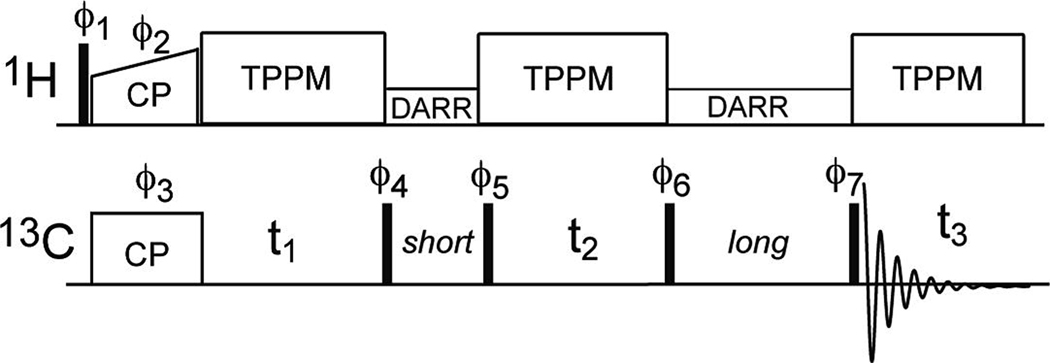
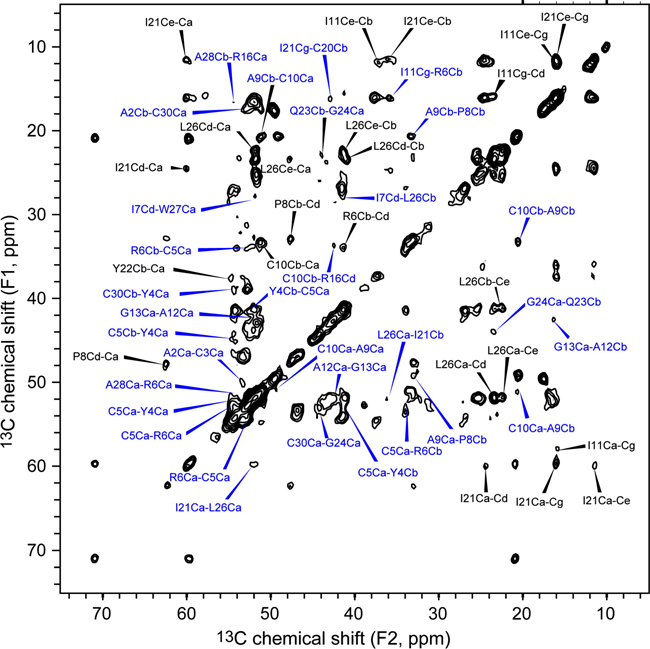
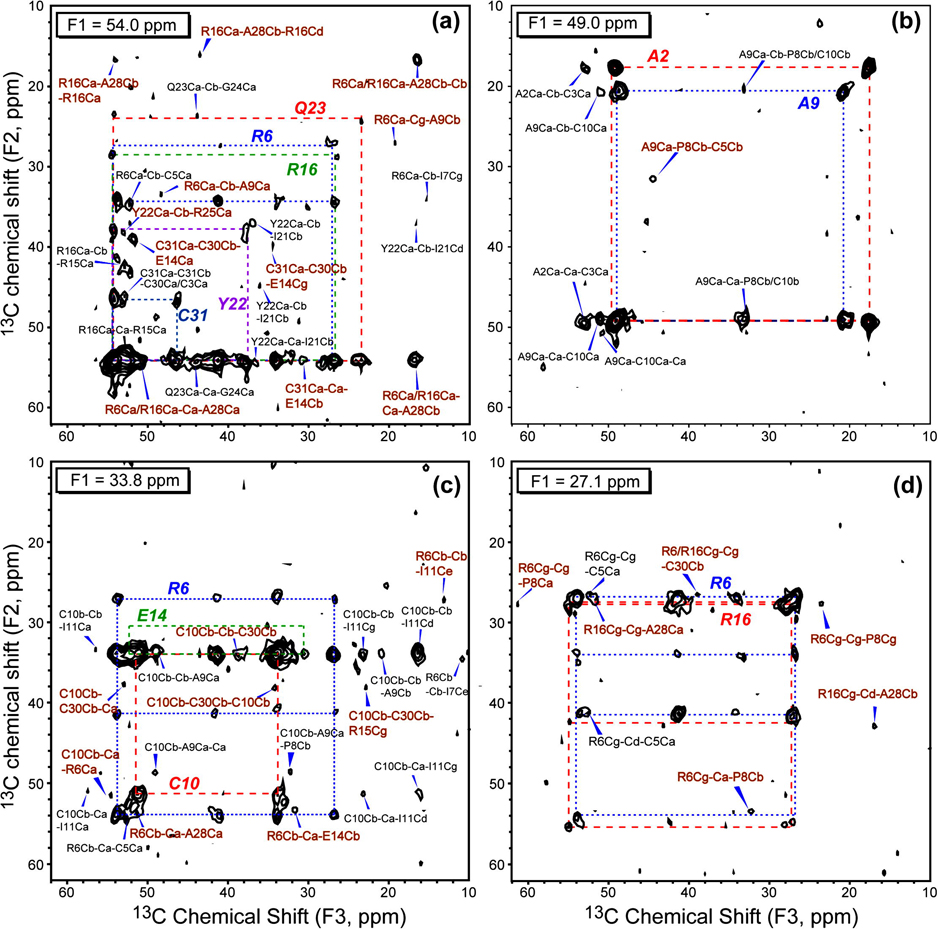
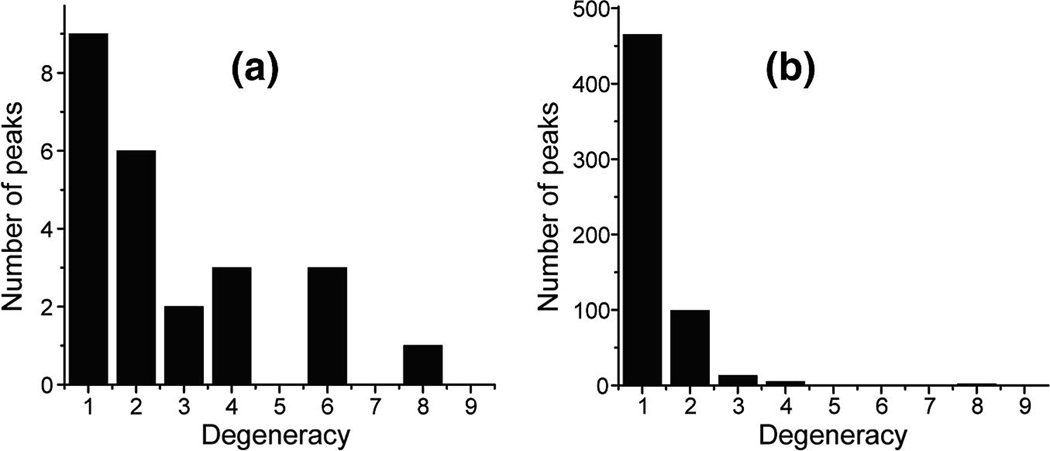
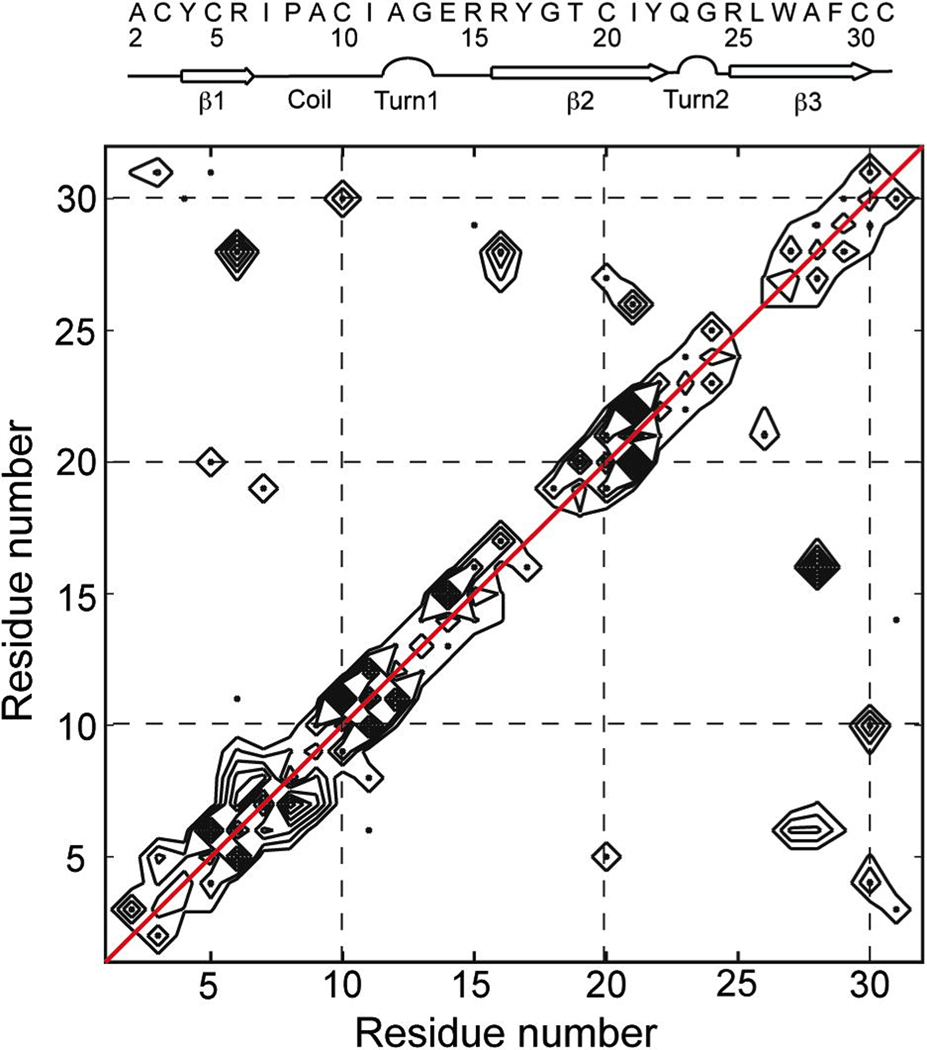
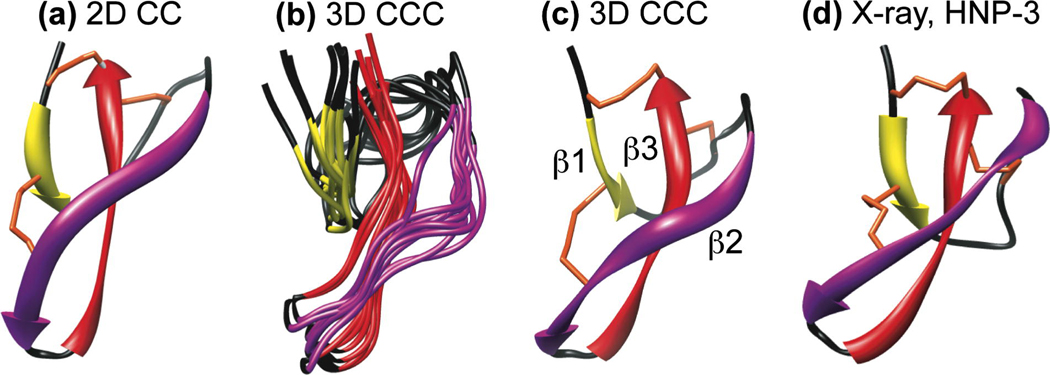
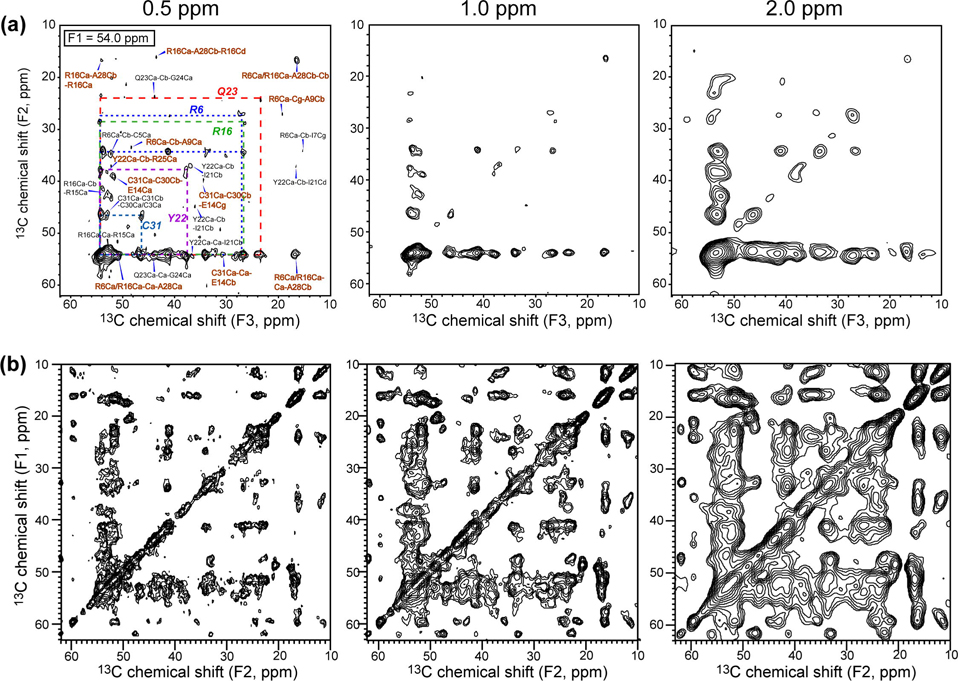
The de novo structure of an antimicrobial protein, human alpha-defensin 1 (HNP-1), is determined by combining a 3D (13)C-(13)C-(13)C (CCC) magic-angle spinning (MAS) correlation experiment with standard resonance assignment experiments. Using a short spin diffusion mixing time to assign intra-residue cross peaks and a long mixing time to detect inter-residue correlation peaks, we show that the 3D CCC experiment not only reduces the ambiguity of resonance assignment, but more importantly yields two orders of magnitude more long-range distances without recourse to existing crystal structures. Most of these distance constraints could not be obtained in a de novo fashion from 2D correlation spectra due to significant resonance overlap. Combining the distance constraints from the 3D CCC experiment and the chemical-shift-derived torsion angles, we obtained a de novo high-resolution NMR structure of HNP-1, with a heavy-atom RMSD of 3.4A from the crystal structure of the analogous HNP-3. The average energy of the minimum-energy ensemble is less than of 40kcal/mol. Thus, the 3D CCC experiment provides a reliable means of restraining the three-dimensional structure of insoluble proteins with unknown conformations.
Copyright 2009 Elsevier Inc. All rights reserved.
Figures
Similar articles
-
Resonance assignment and three-dimensional structure determination of a human alpha-defensin, HNP-1, by solid-state NMR.J Mol Biol. 2010 Mar 26;397(2):408-22. doi: 10.1016/j.jmb.2010.01.030. Epub 2010 Jan 22. J Mol Biol. 2010. PMID: 20097206 Free PMC article.
-
NMR studies of defensin antimicrobial peptides. 1. Resonance assignment and secondary structure determination of rabbit NP-2 and human HNP-1.Biochemistry. 1992 Nov 24;31(46):11348-56. doi: 10.1021/bi00161a012. Biochemistry. 1992. PMID: 1445872
-
3D structure determination of the Crh protein from highly ambiguous solid-state NMR restraints.J Am Chem Soc. 2008 Mar 19;130(11):3579-89. doi: 10.1021/ja078014t. Epub 2008 Feb 20. J Am Chem Soc. 2008. PMID: 18284240
-
Dipolar recoupling in MAS spectra of biological solids.Nat Struct Biol. 1998 Jul;5 Suppl:508-12. doi: 10.1038/749. Nat Struct Biol. 1998. PMID: 9665180 Review.
-
Recent developments in solid-state magic-angle spinning, nuclear magnetic resonance of fully and significantly isotopically labelled peptides and proteins.Philos Trans R Soc Lond B Biol Sci. 2004 Jun 29;359(1446):997-1008. doi: 10.1098/rstb.2003.1398. Philos Trans R Soc Lond B Biol Sci. 2004. PMID: 15306412 Free PMC article. Review.
Cited by
-
Structure and dynamics of cationic membrane peptides and proteins: insights from solid-state NMR.Protein Sci. 2011 Apr;20(4):641-55. doi: 10.1002/pro.600. Epub 2011 Mar 7. Protein Sci. 2011. PMID: 21344534 Free PMC article.
-
Relaxation-compensated difference spin diffusion NMR for detecting 13C-13C long-range correlations in proteins and polysaccharides.J Biomol NMR. 2015 Feb;61(2):97-107. doi: 10.1007/s10858-014-9889-0. Epub 2014 Dec 16. J Biomol NMR. 2015. PMID: 25510834 Free PMC article.
-
Atomic structures of closed and open influenza B M2 proton channel reveal the conduction mechanism.Nat Struct Mol Biol. 2020 Feb;27(2):160-167. doi: 10.1038/s41594-019-0371-2. Epub 2020 Feb 3. Nat Struct Mol Biol. 2020. PMID: 32015551 Free PMC article.
-
The membrane-bound structure and topology of a human α-defensin indicate a dimer pore mechanism for membrane disruption.Biochemistry. 2010 Nov 16;49(45):9770-82. doi: 10.1021/bi101512j. Epub 2010 Oct 26. Biochemistry. 2010. PMID: 20961099 Free PMC article.
-
Intramolecular 1H-13C distance measurement in uniformly 13C, 15N labeled peptides by solid-state NMR.Solid State Nucl Magn Reson. 2012 Jul-Sep;45-46:51-8. doi: 10.1016/j.ssnmr.2012.06.001. Epub 2012 Jun 15. Solid State Nucl Magn Reson. 2012. PMID: 22749432 Free PMC article.
References
-
- Spera S, Bax A. Empirical Correlation between Protein Backbone Conformation and C-Alpha and C-Beta C-13 Nuclear-Magnetic-Resonance Chemical-Shifts. J. Am. Chem. Soc. 1991;113:5490–5492.
-
- Dedios AC, Pearson JG, Oldfield E. Secondary and Tertiary Structural Effects on Protein Nmr Chemical-Shifts - an Abinitio Approach. Science. 1993;260:1491–1496. - PubMed
-
- Seidel K, Etzkorn M, Schneider R, Ader C, Baldus M. Comparative analysis of NMR chemical shift predictions for proteins in the solid phase. Solid State Nucl. Magn. Reson. 2009;35:235–242. - PubMed
-
- Yao XL, Hong M. Determination of Ca chemical shift tensor orientation in peptides by dipolar-modulated chemical shift recoupling NMR spectroscopy. J. Am. Chem. Soc. 2002;124:2730–2738. - PubMed
Publication types
MeSH terms
Substances
Grants and funding
LinkOut - more resources
Full Text Sources
