. 2009:2009:4194-7.
doi: 10.1109/IEMBS.2009.5334048.

Monitoring intramyocardial reentry using alternating transillumination

Affiliations

Monitoring intramyocardial reentry using alternating transillumination

Bogdan G Mitrea et al. Annu Int Conf IEEE Eng Med Biol Soc. 2009.

Abstract

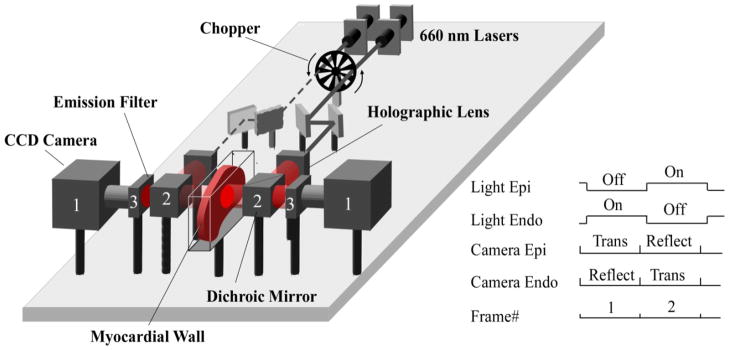
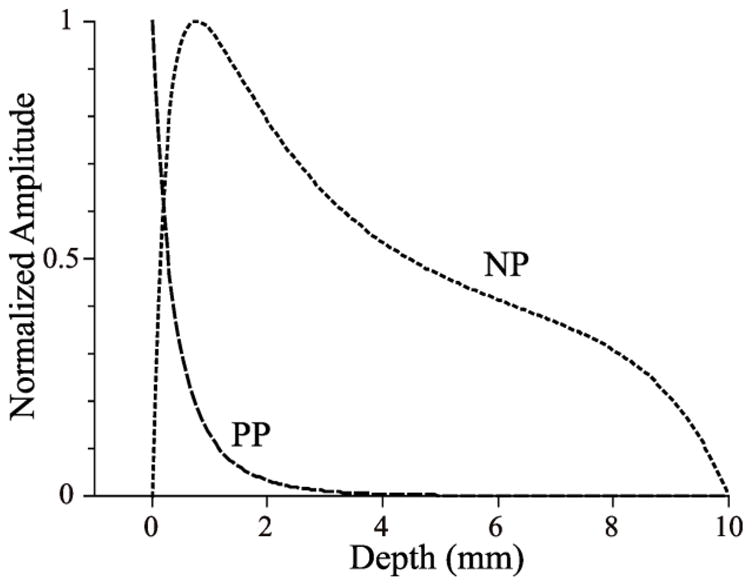
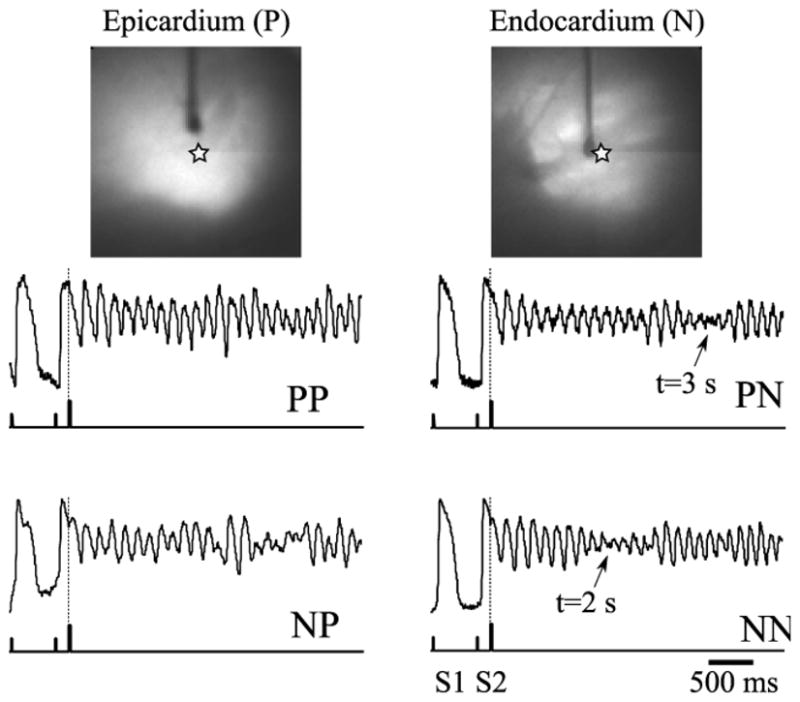
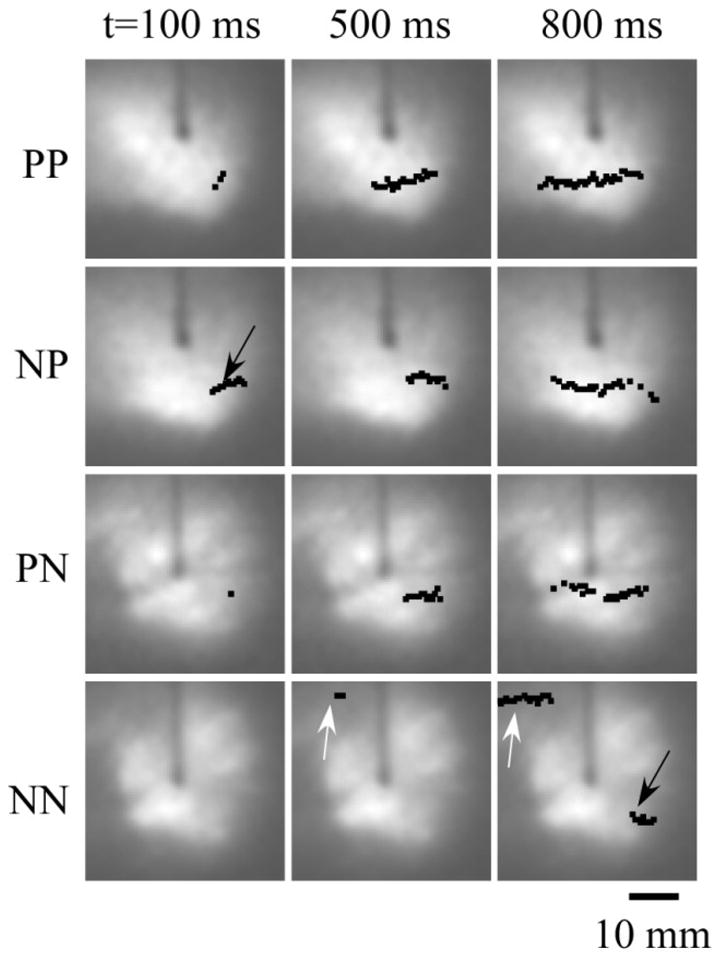
Intramyocardial reentry is implicated as a primary cause of the most deadly cardiac arrhythmias known as polymorphic ventricular tachycardia and ventricular fibrillation. However, the mechanisms involved in the triggering of such reentry and controlling its subsequent dynamics remain poorly understood. One of the major obstacles has been a lack of adequate tools that would enable 3D imaging of electrical excitation and reentry inside thick ventricular wall. Here, we present a new experimental technique, termed alternating transillumination (AT), aimed at filling this gap. The AT technique utilizes a recently synthesized near-infrared fluorescent voltage-sensitive dye, DI-4-ANBDQBS. We apply AT to study the dynamics of reentry during shock-induced polymorphic ventricular tachycardia in pig myocardium.


Figures

Figure 1
Figure 1. Alternating transillumination system
The chopper modulates two laser beams to produce alternating illumination of either the epicardial or endocardial sides of the myocardial wall. The panel shows the phase when the beam from the left laser (dashed line) is blocked by the chopper, while the right beam (solid line) passes through. Before reaching the myocardium, each beam is expanded by a holographic lens and is directed towards the surface via a dichroic mirror (2). After passing through the dichroic mirrors (2) and long pass filters (3) located on both sides of the preparation, the emitted voltage-dependent fluorescent signals are recorded simultaneously with two fast CCD cameras (1). The synchronization diagram of the cameras and the chopper is shown on the right inset. “Trans” and “Reflect” indicate the cameras’ recording modes (reflection versus transillumination).
Figure 2
Figure 2. Representation of myocardial layers in reflection and transillumination images
The depth dependences of peak epicardial pixel intensities are shown in PP and NP imaging modes. The curves were calculated using the diffusion approximation. The dimensionless excitation and emission attenuation lengths, relative to the slab thickness, are 0.25 and 0.33 in both modes. Here, we see that NP is probing deeper than PP; the latter more strongly emphasizes the epicardial layer itself.
Figure 3
Figure 3. Initiation of a polymorphic tachycardia via premature stimulation
Top: Epicardial and endocardial views of the preparation. Vertical dark shadows show the stimulating electrodes. Bottom: Single pixel recordings near the tip of the stimulating electrode (indicated as a star on top panels) extracted from the PP, PN, NP, and NN movies. The (x,y) coordinates of the pixel are the same for all four traces. The ticks on the lower trace show the timing of the basic (S1) and the premature (S2) stimuli. Note a significant decrease in signal amplitude in PN and NN recordings at 2 and 3 seconds past the arrhythmia initiation (arrows). The drop is caused by a drifting filament passing the recording site.
Figure 4
Figure 4. Filament dynamics in various layers
Black dots and arrows show the location of the filament center. Numbers on top indicate the time after the S2 stimulus. The filament originates in the NP layer, grows slowly, and reaches the endocardial NN layer at t=800 ms. White arrows show the formation and growth of the second filament in the NN layer.

References

    1. Rosenbaum DS, Jalife J. Optical mapping of cardiac excitation and arrhythmias. Wiley; 2001.
    1. Baxter WT, Mironov SF, Zaitsev AV, Jalife J, Pertsov AM. Visualizing excitation waves inside cardiac muscle using transillumination. Biophysical Journal. 2001;80:516–530. - PMC - PubMed
    1. Matiukas A, Mitrea BG, Qin M, Pertsov AM, Shvedko AG, Warren MD, Zaitsev AV, Wuskell JP, Wei M, Watras J. Near-infrared voltage-sensitive fluorescent dyes optimized for optical mapping in blood-perfused myocardium. Heart Rhythm. 2007;4:1441–1451. - PMC - PubMed
    1. Khait VD, Bernus O, Mironov SF, Pertsov AM. Method for the three-dimensional localization of intramyocardial excitation centers using optical imaging. Journal of Biomedical Optics. 2006;11:034007. - PubMed
    1. DPZMD, JJMD . Cardiac Electrophysiology: From Cell to Bedside: Expert Consult - Online and Print. Saunders; 2009.

Publication types