

Comparative analysis of three different modalities for characterization of the seismocardiogram
- PMID: 19964786
- PMCID: PMC3313588
- DOI: 10.1109/IEMBS.2009.5334444
Comparative analysis of three different modalities for characterization of the seismocardiogram
Abstract
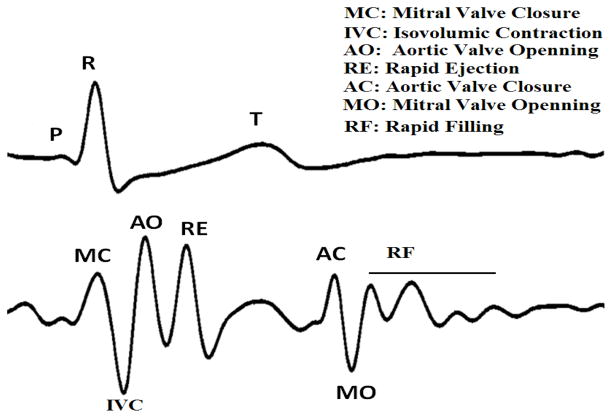
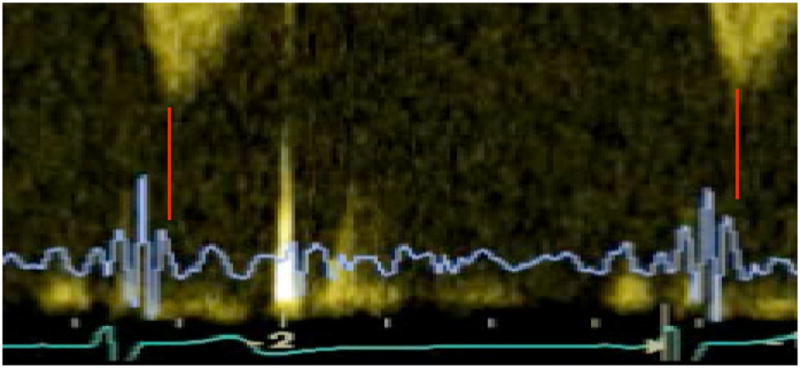
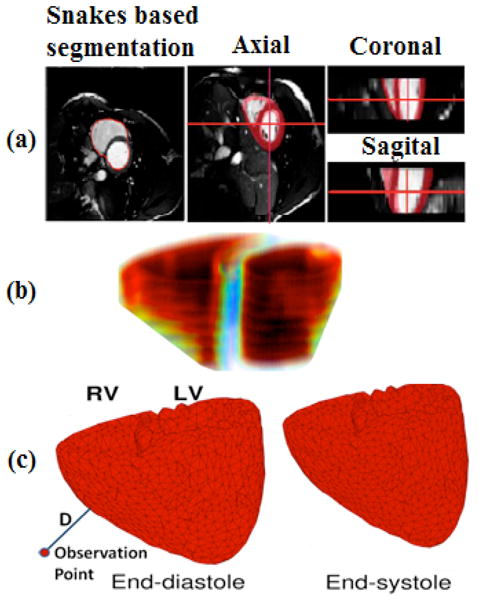
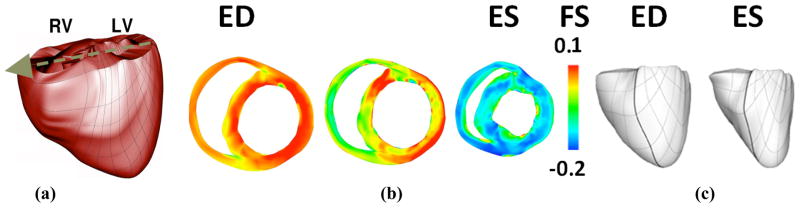
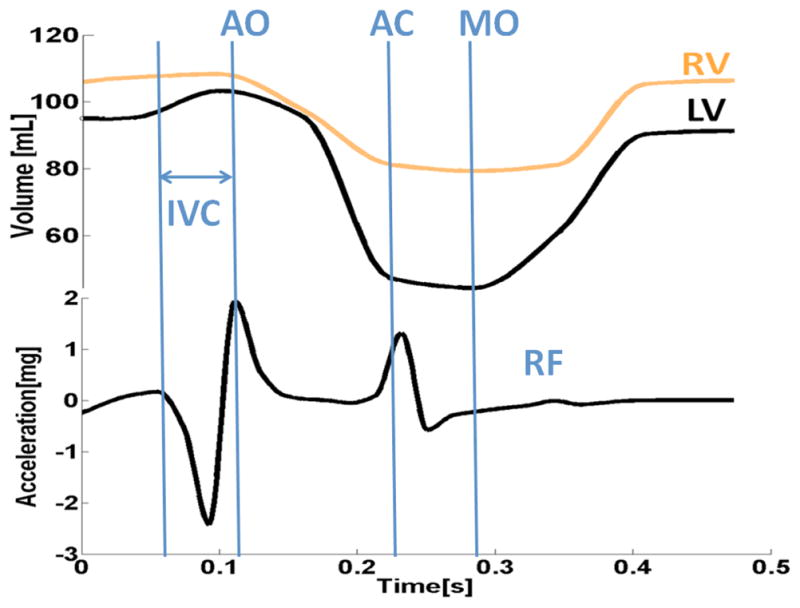
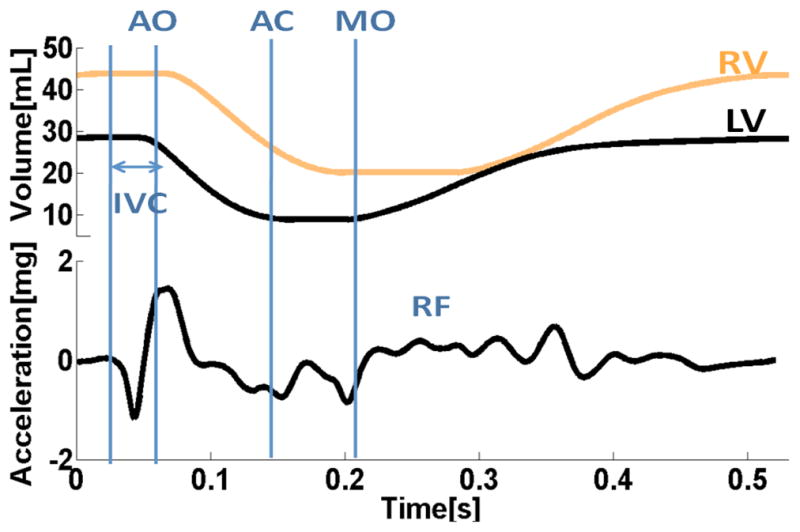
We introduce and compare three different modalities to study seismocardiogram (SCG) and its correlation with cardiac events. We used an accelerometer attached to the subject sternum to get a reference measure. Cardiac events were then approximately identified using echocardiography. As an alternative approximation, we used consecutive Cine-MRI images of the heart to capture cardiac movements and compared them with the experimental SCG. We also employed an anatomically accurate, finite element base electromechanical model with geometry built completely from DT-MRI to simulate a portion of the cardiac cycle as observed in the SCG signal. The preliminary results demonstrate the usability of these newly proposed methods to investigate the mechanism of SCG waves and also demonstrate the usability of echocardiograph in interpretation of these results in terms of correlating them to underlying cardiac cycle events.
Figures
References
-
- Salerno D, Zanetti J. Seismocardiography: A new technique for recording cardiac vibration. Concept, method and initial observation. J Cardiovasc Technol. 1990;9:111–117.
-
- Starr I, Wood EC. Twenty Years Studies with the Ballistocardiograph, the Relation Between the Amplitude of the First Record of ‘Health’ Adults and Eventual Mortality and Morbidity form Heart Disease. Circulation. 1961;23:714–732.
-
- Akhbardeh A, Junnila S, Koivuluoma M, Koivistoinen T, Turjanmaa V, Kööbi T, Värri A. Towards a Heart Disease Diagnosing System based on Force Sensitive chair’s measurement, Biorthogonal Wavelets and Neural Network classifiers. Engineering Applications on Artificial Intelligence. 2007;20(4):493–502.
-
- Jansen BH, Larson BH, Shankar K. Monitoring of the ballistocardiogram with the static charge sensitive bed. IEEE Trans on Biomedical Eng. 1991;38(8):748–751. - PubMed
-
- McKay WPS, Peter H, Gregon H, McKay B, Militzer J. Sternal acceleration ballistocardiography and arterial pressure wave analysis to determine stroke volume. Clin Invest Med. 1999;22(1):4–14. - PubMed
Publication types
MeSH terms
Grants and funding
LinkOut - more resources
Full Text Sources
Other Literature Sources
Research Materials