

PPARdelta is a fatty acid sensor that enhances mitochondrial oxidation in insulin-secreting cells and protects against fatty acid-induced dysfunction
- PMID: 19965574
- PMCID: PMC3035500
- DOI: 10.1194/jlr.M001123
PPARdelta is a fatty acid sensor that enhances mitochondrial oxidation in insulin-secreting cells and protects against fatty acid-induced dysfunction
Abstract
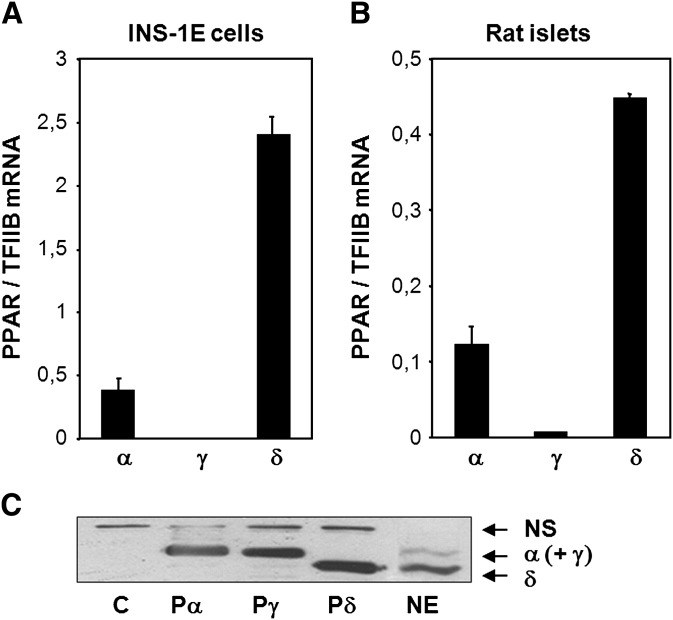
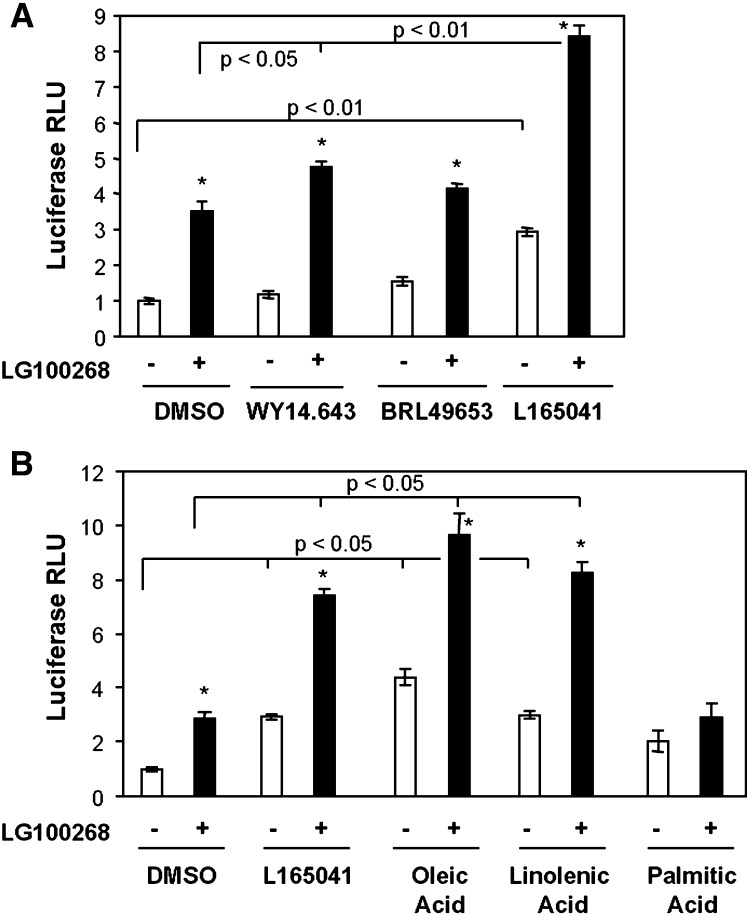
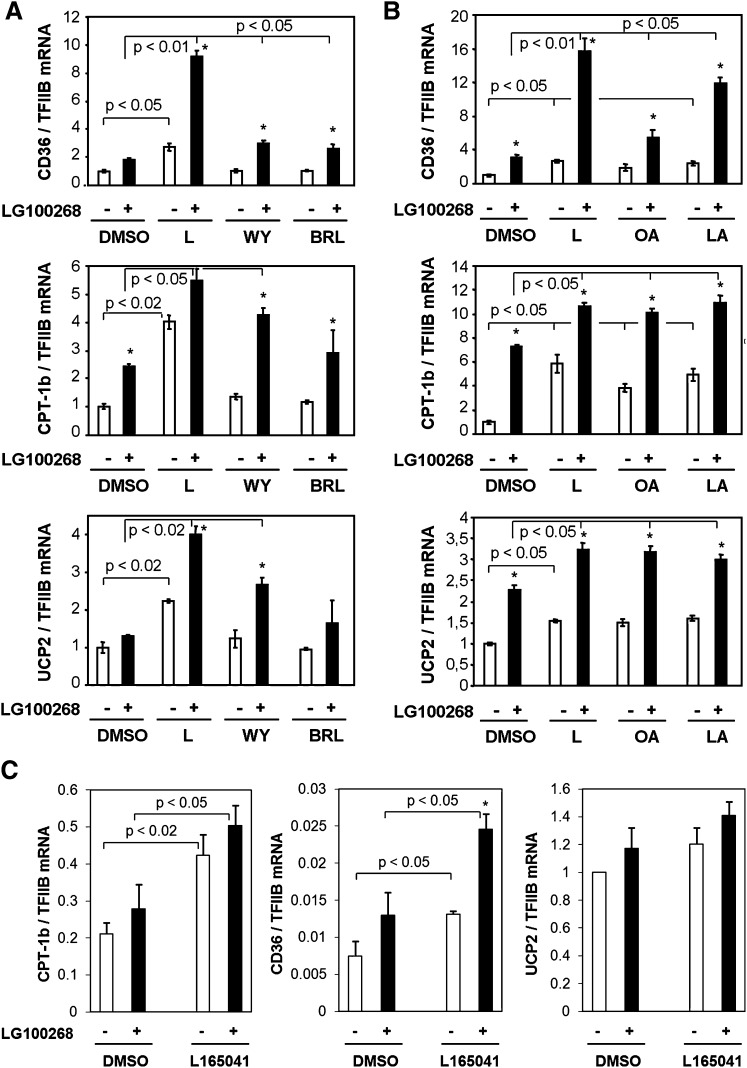
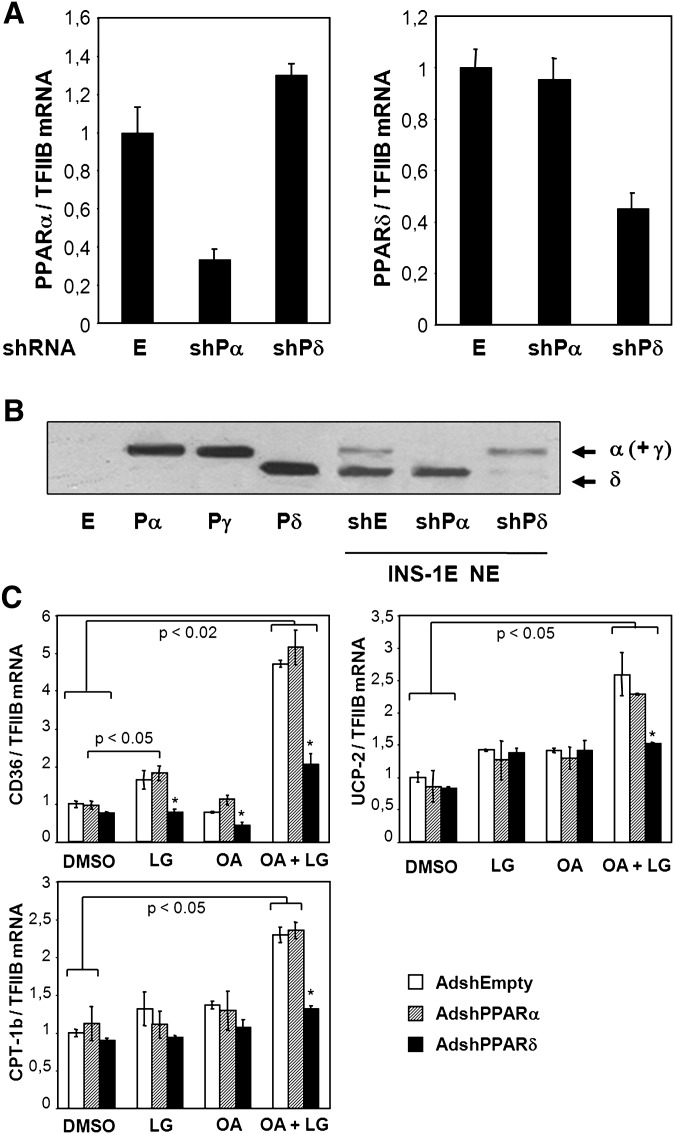
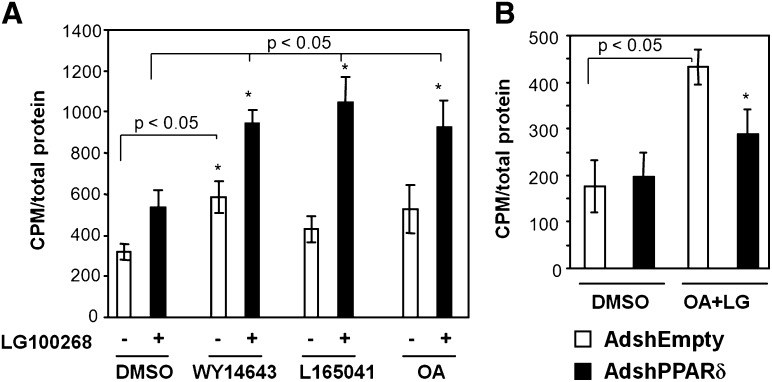
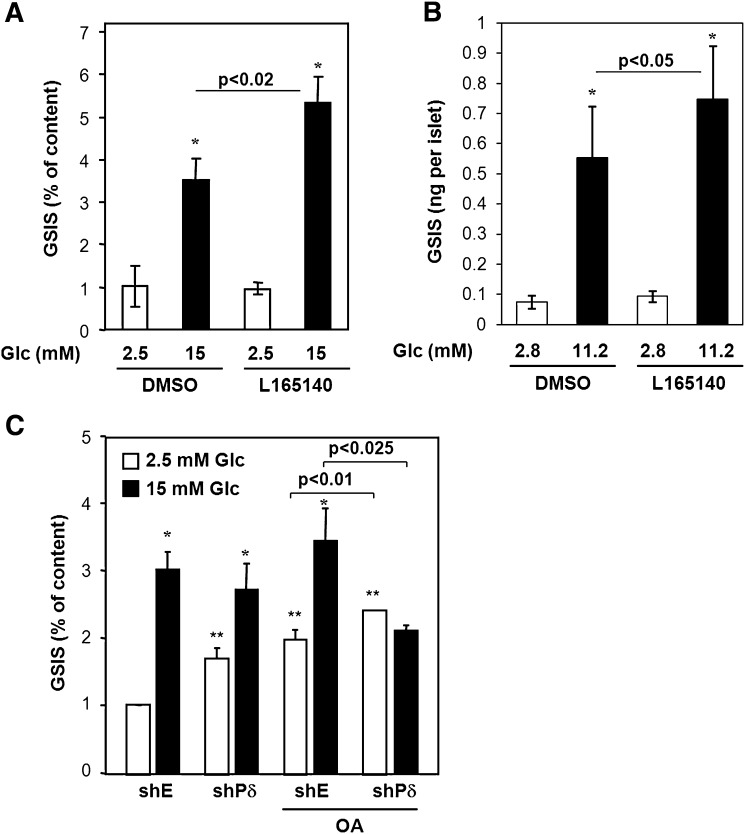
The peroxisome proliferator-activated receptor delta (PPARdelta) is implicated in regulation of mitochondrial processes in a number of tissues, and PPARdelta activation is associated with decreased susceptibility to ectopic lipid deposition and metabolic disease. Here, we show that PPARdelta is the PPAR subtype expressed at the highest level in insulinoma cells and rat pancreatic islets. Furthermore, PPARdelta displays high transcriptional activity and acts in pronounced synergy with retinoid-X-receptor (RXR). Interestingly, unsaturated fatty acids mimic the effects of synthetic PPARdelta agonists. Using short hairpin RNA-mediated knockdown, we demonstrate that the ability of unsaturated fatty acids to stimulate fatty acid metabolism is dependent on PPARdelta. Activation of PPARdelta increases the fatty acid oxidation capacity in INS-1E beta-cells, enhances glucose-stimulated insulin secretion (GSIS) from islets, and protects GSIS against adverse effects of prolonged fatty acid exposure. The presented results indicate that the nuclear receptor PPARdelta is a fatty acid sensor that adapts beta-cell mitochondrial function to long-term changes in unsaturated fatty acid levels. As maintenance of mitochondrial metabolism is essential to preserve beta-cell function, these data indicate that dietary or pharmacological activation of PPARdelta and RXR may be beneficial in the prevention of beta-cell dysfunction.
Figures
Similar articles
-
Activation of PPARdelta up-regulates fatty acid oxidation and energy uncoupling genes of mitochondria and reduces palmitate-induced apoptosis in pancreatic beta-cells.Biochem Biophys Res Commun. 2010 Jan 15;391(3):1567-72. doi: 10.1016/j.bbrc.2009.12.127. Epub 2009 Dec 27. Biochem Biophys Res Commun. 2010. PMID: 20040361
-
Desnutrin/ATGL activates PPARδ to promote mitochondrial function for insulin secretion in islet β cells.Cell Metab. 2013 Dec 3;18(6):883-95. doi: 10.1016/j.cmet.2013.10.012. Epub 2013 Nov 21. Cell Metab. 2013. PMID: 24268737 Free PMC article.
-
Role of lipid peroxidation and PPAR-δ in amplifying glucose-stimulated insulin secretion.Diabetes. 2011 Nov;60(11):2830-42. doi: 10.2337/db11-0347. Epub 2011 Sep 6. Diabetes. 2011. PMID: 21896929 Free PMC article.
-
Roles of peroxisome proliferator-activated receptor delta (PPARdelta) in the control of fatty acid catabolism. A new target for the treatment of metabolic syndrome.Biochimie. 2004 Nov;86(11):833-7. doi: 10.1016/j.biochi.2004.09.024. Biochimie. 2004. PMID: 15589693 Review.
-
Roles of PPAR delta in lipid absorption and metabolism: a new target for the treatment of type 2 diabetes.Biochim Biophys Acta. 2005 May 30;1740(2):313-7. doi: 10.1016/j.bbadis.2004.11.011. Epub 2004 Dec 8. Biochim Biophys Acta. 2005. PMID: 15949697 Review.
Cited by
-
Nrf2 modulates the benefits of evening exercise in type 2 diabetes.Sports Med Health Sci. 2023 Sep 9;5(4):251-258. doi: 10.1016/j.smhs.2023.09.001. eCollection 2023 Dec. Sports Med Health Sci. 2023. PMID: 38314046 Free PMC article. Review.
-
Protective Role of PPARdelta in Lipoapoptosis of Pancreatic β Cells.Lipids. 2016 Nov;51(11):1259-1268. doi: 10.1007/s11745-016-4190-5. Epub 2016 Sep 8. Lipids. 2016. PMID: 27631677
-
The interplay between non-esterified fatty acids and bovine peroxisome proliferator-activated receptors: results of an in vitro hybrid approach.J Anim Sci Biotechnol. 2020 Aug 11;11:91. doi: 10.1186/s40104-020-00481-y. eCollection 2020. J Anim Sci Biotechnol. 2020. PMID: 32793344 Free PMC article.
-
Effects of canola and high-oleic-acid canola oils on abdominal fat mass in individuals with central obesity.Obesity (Silver Spring). 2016 Nov;24(11):2261-2268. doi: 10.1002/oby.21584. Obesity (Silver Spring). 2016. PMID: 27804268 Free PMC article. Clinical Trial.
-
Oxidized linoleic acid metabolites induce liver mitochondrial dysfunction, apoptosis, and NLRP3 activation in mice.J Lipid Res. 2018 Sep;59(9):1597-1609. doi: 10.1194/jlr.M083741. Epub 2018 Jul 3. J Lipid Res. 2018. PMID: 30084831 Free PMC article.
References
-
- Evans R. M., Barish G. D., Wang Y. X. 2004. PPARs and the complex journey to obesity. Nat. Med. 10: 355–361. - PubMed
-
- Brun R. P., Tontonoz P., Forman B. M., Ellis R., Chen J., Evans R. M., Spiegelman B. M. 1996. Differential activation of adipogenesis by multiple PPAR isoforms. Genes Dev. 10: 974–984. - PubMed
-
- Tachibana K., Kobayashi Y., Tanaka T., Tagami M., Sugiyama A., Katayama T., Ueda C., Yamasaki D., Ishimoto K., Sumitomo M., et al. 2005. Gene expression profiling of potential peroxisome proliferator-activated receptor (PPAR) target genes in human hepatoblastoma cell lines inducibly expressing different PPAR isoforms. Nucl. Recept. 3: 3. - PMC - PubMed
-
- Dillon J. S., Yaney G. C., Zhou Y., Voilley N., Bowen S., Chipkin S., Bliss C. R., Schultz V., Schuit F. C., Prentki M., et al. 2000. Dehydroepiandrosterone sulfate and beta-cell function: enhanced glucose-induced insulin secretion and altered gene expression in rodent pancreatic beta-cells. Diabetes. 49: 2012–2020. - PubMed
Publication types
MeSH terms
Substances
LinkOut - more resources
Full Text Sources
Other Literature Sources
Molecular Biology Databases
Research Materials
