. 2010 Apr;51(4):832-42.
doi: 10.1194/jlr.M002782. Epub 2009 Oct 28.

Glucose stimulates cholesterol 7alpha-hydroxylase gene transcription in human hepatocytes

Affiliations

Glucose stimulates cholesterol 7alpha-hydroxylase gene transcription in human hepatocytes

Tiangang Li et al. J Lipid Res. 2010 Apr.

Abstract

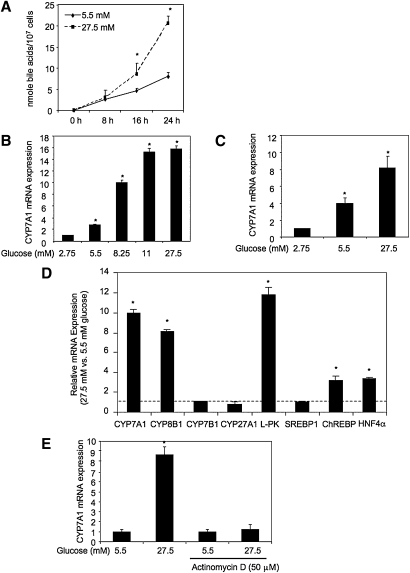
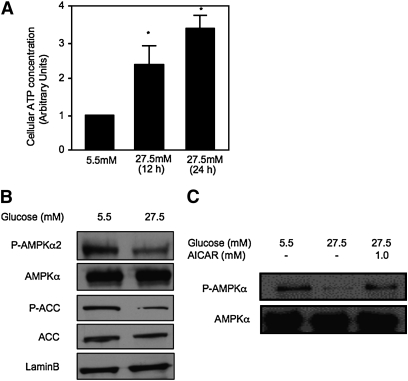
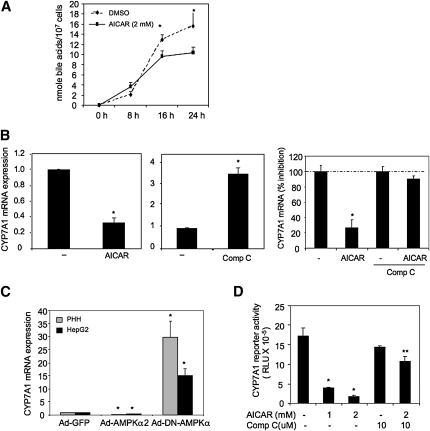
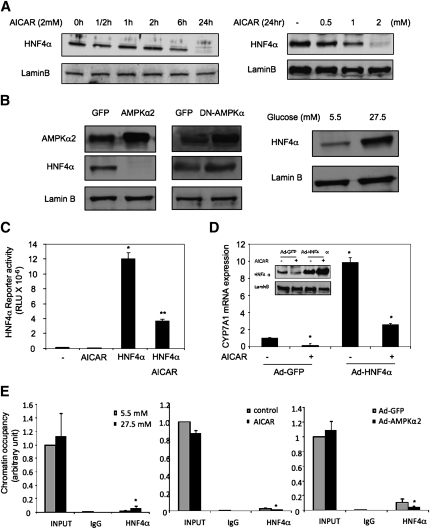
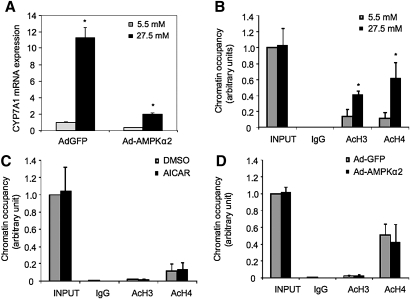
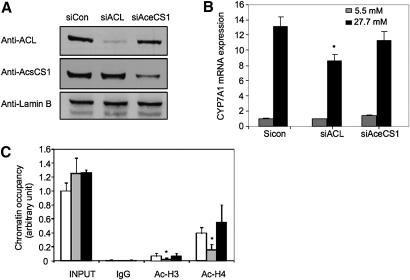
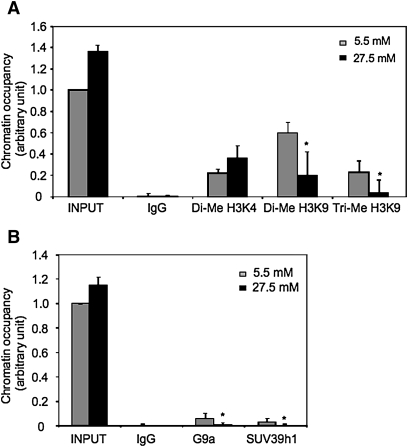
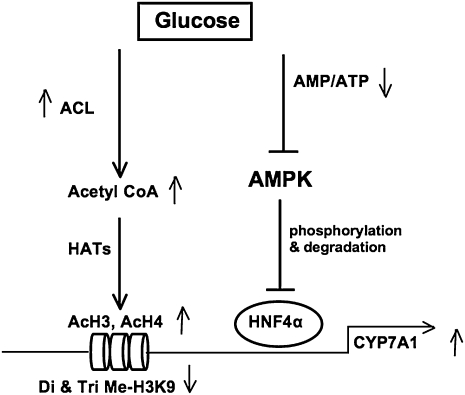
Bile acids play important roles in the regulation of lipid, glucose, and energy homeostasis. Recent studies suggest that glucose regulates gene transcription in the liver. The aim of this study was to investigate the potential role of glucose in regulation of bile acid synthesis in human hepatocytes. High glucose stimulated bile acid synthesis and induced mRNA expression of cholesterol 7alpha-hydroxylase (CYP7A1), the key regulatory gene in bile acid synthesis. Activation of an AMP-activated protein kinase (AMPK) decreased CYP7A1 mRNA, hepatocyte nuclear factor 4alpha (HNF4alpha) protein, and binding to CYP7A1 chromatin. Glucose increased ATP levels to inhibit AMPK and induce HNF4alpha to stimulate CYP7A1 gene transcription. Furthermore, glucose increased histone acetylation and decreased H3K9 di- and tri-methylation in the CYP7A1 chromatin. Knockdown of ATP-citrate lyase, which converts citrate to acetyl-CoA, decreased histone acetylation and attenuated glucose induction of CYP7A1 mRNA expression. These results suggest that glucose signaling also induces CYP7A1 gene transcription by epigenetic regulation of the histone acetylation status. This study uncovers a novel link between hepatic glucose metabolism and bile acid synthesis. Glucose induction of bile acid synthesis may have an important implication in metabolic control of glucose, lipid, and energy homeostasis under normal and diabetic conditions.


Figures

Fig. 1.
Fig. 1.
Glucose induces CYP7A1 mRNA expression and bile acid synthesis. A: Effect of glucose on bile acid synthesis in HepG2 cells. B: Effect of glucose on CYP7A1 mRNA expression in HepG2 cells. C: Effect of glucose on CYP7A1 mRNA expression in primary human hepatocytes cells. D: Effect of glucose on relative mRNA expression levels of the genes involved in bile acid synthetic and glucose metabolism in HepG2 cells. The ratios of relative mRNA expression levels in cells cultured in 27.5 mM versus 5.5 mM glucose are presented. E: Effect of actinomycin D on glucose induction of CYP7A1 mRNA expression in HepG2 cells. HepG2 cells (A, B, D, and E) or primary human hepatocytes (C) were cultured in glucose/pyruvate-free DMEM media supplemented with glucose at concentration and time indicated. Real-time PCR was used to assay relative mRNA expression. Bile acids in the culture media and cell lysate were quantified as described under Materials and Methods. * indicates statistical significance, n = 3, P < 0.05, 27.5 mM versus 5.5 mM glucose (A, D, and E); glucose concentrations versus 2.75 mM glucose (B and C).
Fig. 2.
Fig. 2.
Glucose inhibits AMPK activation. HepG2 cells (A and B) or primary human hepatocytes (C) were cultured in glucose/pyruvate-free DMEM media supplemented with 5.5 mM glucose for 24 h. Cells were then treated with glucose and/or AICAR for 24 h at concentrations indicated. A: Cellular ATP levels were determined as described under Materials and Methods and expressed as mean ± SD. * indicates statistical significance, n = 3, P < 0.05, 27.5 mM versus 5.5 mM glucose. Protein expressions were determined by immunoblot using specific antibodies.
Fig. 3.
Fig. 3.
Activation of AMPK inhibits bile acid synthesis and CYP7A1 mRNA expression in hepatocytes. A: HepG2 cells were treated with vehicle (DMSO) or AICAR (2 mM) for the time and doses indicated. Total bile acids in culture media and cell lysates were quantified. B: Primary human hepatocytes (n = 3) were treated with vehicle (DMSO), 2 mM AICAR (left panel) or (10 μM) Compound C (middle panel), and HepG2 cells were pretreated with 10 μM compound C for 1 h followed by DMSO or AICAR (2 mM) (right panel) for 24 h. CYP7A1 mRNA expression levels were determined by real-time PCR. * indicates statistical significance, n = 3, P < 0.05, AICAR or Compound C-treated versus vehicle control (DMSO). C: Primary human hepatocytes (n = 3) or HepG2 cells were infected with Ad-GFP, Ad-AMPKα2, or Ad-DN-AMPK at MOI of 10 for 24 h. * indicates statistical significance, n = 3, P < 0.05, Ad-DNAMPKα2, or Ad-AMPKα2 versus Ad-GFP (control). D: Effect of AICAR and/or Compound C on human CYP7A1 reporter activity. HepG2 cells were transfected with a human CYP7A1 reporter (ph-1887-luc CYP7A1), and treated with AICAR and/or Compound C in the concentrations indicated. Reporter activities were assayed as described under Material and Methods. CYP7A1 mRNA expression was determined by real-time PCR. * indicates statistical significance, n = 3, P < 0.05, AICAR versus vehicle (DMSO) control; ** indicates statistical significance, n = 3, P < 0.05, Compound C + AICAR versus AICAR.
Fig. 4.
Fig. 4.
AMPK inhibits CYP7A1 gene expression via inhibition of HNF4α protein and transactivation activity. A: HepG2 cells were treated with AICAR (2 mM) for the time and dose indicated and HNF4α protein levels were determined by immunoblot. B: HepG2 cells were infected by either Ad-GFP, Ad-AMPKα2, or Ad-DN-AMPK at an MOI of ∼10 (left panel), or treated with glucose (right panel) for 24 h. Immunoblot analyses were performed using antibodies indicated. C: AICAR inhibits HNF4α reporter activity in transient transfection assays. HepG2 cells were transfected with a heterologous HNF4α reporter (4XHNF4α-tk-Luc) and a HNF4α expression plasmid. Cells were treated with AICAR (2 mM) as indicated. D: HepG2 cells were infected with Ad-GFP or Ad-HNF4α at an MOI of ∼10 for 24 h, followed by an additional 24 h treatment of vehicle (DMSO) or AICAR (2 mM). HNF4α protein was measured by immunoblot (inset). CYP7A1 mRNA expression was determined by real-time PCR. * indicates statistical significance, n = 3, P < 0.05, AICAR-treated versus control (DMSO treated or Ad-GFP infected). E: HepG2 cells were treated with glucose (5.5 mM or 27.5 mM), AICAR (2 mM) or infected with Ad-GFP or Ad-AMPKα2 (MOI = 10) for 24 h as indicated. The occupancy of HNF4α in CYP7A1 chromatin was determined by ChIP assays as described under Materials and Methods.
Fig. 5.
Fig. 5.
Glucose induces histone acetylation in CYP7A1 chromatin. A: HepG2 cells were infected by Ad-GFP or Ad-AMPKα2 at an MOI of ∼10 for 24 h followed by incubation in media supplemented with 5.5 mM or 27.5 mM glucose for additional 24 h. CYP7A1 mRNA levels were determined by real time PCR. * indicates statistical significance, n = 3, P < 0.05, 27.5 mM versus 5.5 mM glucose. B: HepG2 cells were treated with glucose (5.5 mM or 27.5 mM) for 24 h as indicated. The acetyl-H3 (Ac-H3) and acetyl-H4 (Ac-H4) in CYP7A1 gene chromatin were determined by ChIP assays as described under Materials and Methods. C: HepG2 cells were treated with vehicle control or AICAR (2 mM) for 24 h, and Ac-H3 and Ac-H4 occupancy in CYP7A1 chromatin was determined by ChIP assays. D: HepG2 cells were infected with Ad-GPF or Ad-AMPKα2 for 24 h. Ac-H3 and Ac-H4 in CYP7A1 chromatin were determined by ChIP assay.
Fig. 6.
Fig. 6.
ACL is required for glucose induction of histone acetylation in CYP7A1. A: Immunoblot of ACL and AceCS1 in HepG2 cells transfected with siRNA control (sicon), siRNA to ACL (siACL) or siRNA to AceCS1 (siAceCS1). B: HepG2 cells were transfected with sicon, siACL, or siAceCS1 probe and treated with 5.5 mM or 27.5 mM glucose for 24 h as described under Materials and Methods. The mRNA expression levels were determined by real-time PCR. * indicates statistical significance, n = 3, P < 0.05, siACL versus sicon. C: HepG2 cells were transfected with sicon (open bar), siACL (gray bar), or siAceCS1 (closed bar), and cultured in 27.5 mM glucose for 24 h. ChIP assays were performed to detect Ac-H3 and Ac-H4 in CYP7A1 chromatin.
Fig. 7.
Fig. 7.
Glucose decreased H3K9 methylation and decreased G9a and SUV39 h1 recruitment under CYP7A1 chromatin. HepG2 cells were treated with 5.5 mM or 27.5 mM glucose as described under Materials and Methods. ChIP assays were performed to detect di-methyl H3K4, di- methyl H3K9, tri-methyl H3K9, G9a and SUV39 h1 in CYP7A1 chromatin.
Fig. 8.
Fig. 8.
A model of glucose activation of CYP7A1 gene transcription in hpatocytes. Glucose induces CYP7A1 gene transcription by two mechanisms. First, high glucose decrease the cellular AMP to ATP ratio, thus results in inhibiting AMPK activity. AMPK is known to phosphorylate and inhibit HNF4α binding to DNA and dimerization. Inactivation of AMPK increases HNF4α recruitment to CYP7A1 chromatin to induce CYP7A1 gene transcription. Second, glucose stimulates CYP7A1 gene transcription by the epigenetic mechanisms. Glucose increases nuclear ACL activity to increase acetyl-CoA, which is a substrate of histone acetyltransferases (HATs). HAT acetylates H3 and H4 on CYP7A1 chromatin, and stimulates gene transcription. Furthermore, glucose reduces chromatin occupancy of a methyltransferase G9a, which is known to inhibit CYP7A1 gene transcription. This results in de-repression of CYP7A1 gene transcription by decreasing di-and tri-methylation of H3K9 in CYP7A1 chromatin.

Similar articles

Cited by

References

    1. Russell D. W., Setchell K. D. 1992. Bile acid biosynthesis. Biochemistry. 31: 4737–4749 - PubMed
    1. Lefebvre P., Cariou B., Lien F., Kuipers F., Staels B. 2009. Role of bile acids and bile acid receptors in metabolic regulation. Physiol. Rev. 89: 147–191 - PubMed
    1. Watanabe M., Houten S. M., Wang L., Moschetta A., Mangelsdorf D. J., Heyman R. A., Moore D. D., Auwerx J. 2004. Bile acids lower triglyceride levels via a pathway involving FXR, SHP, and SREBP-1c. J. Clin. Invest. 113: 1408–1418 - PMC - PubMed
    1. Zhang Y., Lee F. Y., Barrera G., Lee H., Vales C., Gonzalez F. J., Willson T. M., Edwards P. A. 2006. Activation of the nuclear receptor FXR improves hyperglycemia and hyperlipidemia in diabetic mice. Proc. Natl. Acad. Sci. USA. 103: 1006–1011 - PMC - PubMed
    1. Watanabe M., Houten S. M., Mataki C., Christoffolete M. A., Kim B. W., Sato H., Messaddeq N., Harney J. W., Ezaki O., Kodama T., et al. 2006. Bile acids induce energy expenditure by promoting intra cellular thyroid hormone activation. Nature. 439: 484–489 - PubMed

Publication types

MeSH terms