. 2010 Mar 18;115(11):2292-9.
doi: 10.1182/blood-2009-04-213520. Epub 2009 Nov 30.

Hydroxychloroquine protects the annexin A5 anticoagulant shield from disruption by antiphospholipid antibodies: evidence for a novel effect for an old antimalarial drug

Affiliations

Hydroxychloroquine protects the annexin A5 anticoagulant shield from disruption by antiphospholipid antibodies: evidence for a novel effect for an old antimalarial drug

Jacob H Rand et al. Blood. .

Abstract

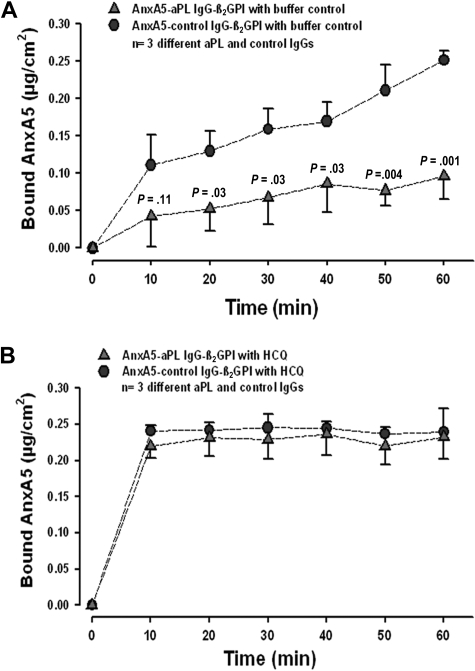
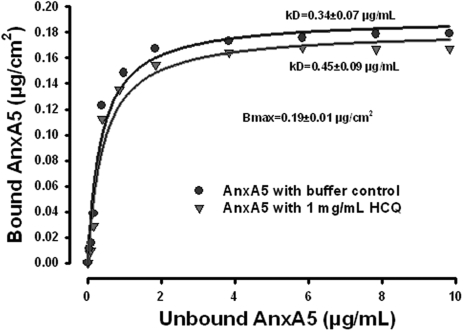
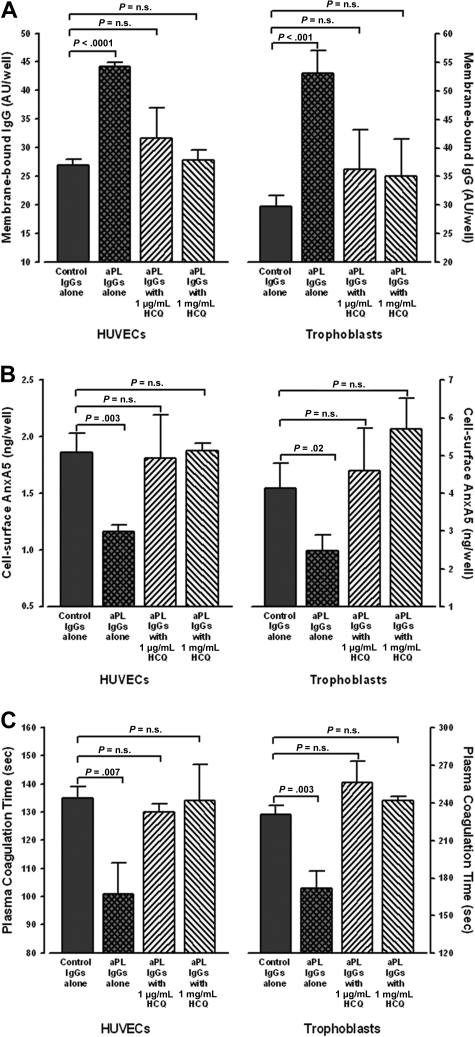
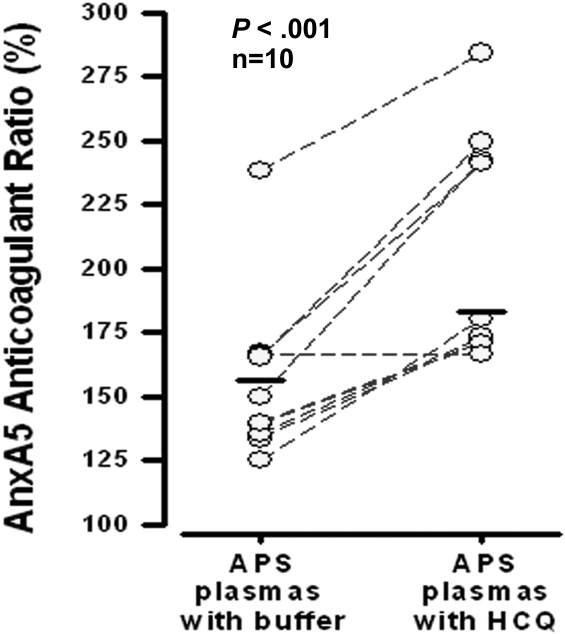
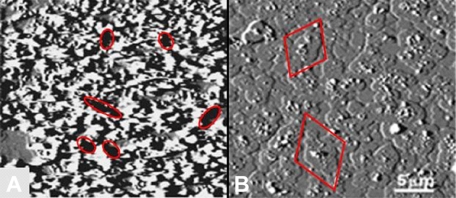
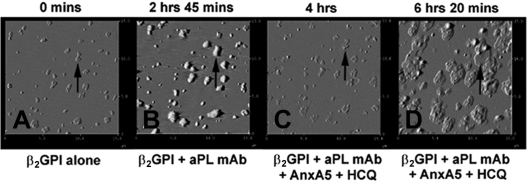
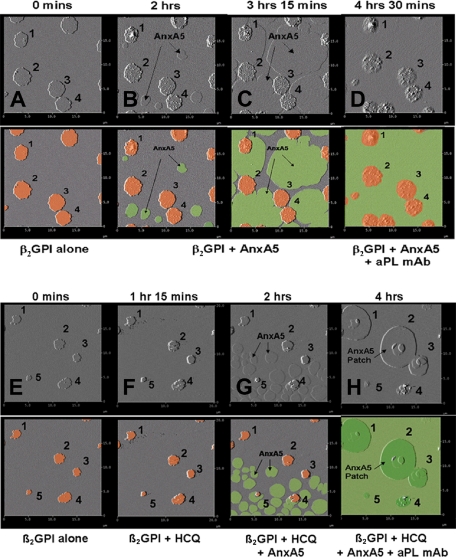
Annexin A5 (AnxA5) is a potent anticoagulant protein that crystallizes over phospholipid bilayers (PLBs), blocking their availability for coagulation reactions. Antiphospholipid antibodies disrupt AnxA5 binding, thereby accelerating coagulation reactions. This disruption may contribute to thrombosis and miscarriages in the antiphospholipid syndrome (APS). We investigated whether the antimalarial drug, hydroxychloroquine (HCQ), might affect this prothrombotic mechanism. Binding of AnxA5 to PLBs was measured with labeled AnxA5 and also imaged with atomic force microscopy. Immunoglobulin G levels, AnxA5, and plasma coagulation times were measured on cultured human umbilical vein endothelial cells and a syncytialized trophoblast cell line. AnxA5 anticoagulant activities of APS patient plasmas were also determined. HCQ reversed the effect of antiphospholipid antibodies on AnxA5 and restored AnxA5 binding to PLBs, an effect corroborated by atomic force microscopy. Similar reversals of antiphospholipid-induced abnormalities were measured on the surfaces of human umbilical vein endothelial cells and syncytialized trophoblast cell lines, wherein HCQ reduced the binding of antiphospholipid antibodies, increased cell-surface AnxA5 concentrations, and prolonged plasma coagulation to control levels. In addition, HCQ increased the AnxA5 anticoagulant activities of APS patient plasmas. In conclusion, HCQ reversed antiphospholipid-mediated disruptions of AnxA5 on PLBs and cultured cells, and in APS patient plasmas. These results support the concept of novel therapeutic approaches that address specific APS disease mechanisms.


Figures

Figure 1
Figure 1
HCQ reverses aPL-mediated reduction of AnxA5 binding to phospholipid bilayers. (A) In the absence of HCQ, aPL IgGs (0.5 mg/mL) significantly reduced the binding of AnxA5 to PS/PC bilayers (quantity measured at 60 minutes: 0.10 ± 0.03 μg/cm2 compared with 0.25 ± 0.01 μg/cm2 for control IgG and β2GPI; n = 3 pairs of different IgGs; P = .001). P values on graph denote differences between aPL and control IgGs (0.5 mg/mL). (B) In the presence of HCQ (1 mg/mL), binding of AnxA5 was restored to levels that were equivalent to control IgG (quantity measured at 60 minutes: 0.23 ± 0.03 μg/cm2 vs 0.24 ± 0.03 μg/cm2 for controls; P = .71). Interestingly, the presence of HCQ accelerated the binding of AnxA5 with control IgG, that is, even in the absence of aPL IgG.
Figure 2
Figure 2
HCQ does not increase AnxA5 binding to phospholipid bilayers. AnxA5-binding isotherm without and with HCQ. The binding affinity of the protein was not increased, and even modestly reduced by HCQ. There was a modest but statistically significant increase of Kd in the presence of HCQ (1 mg/mL), compared with the buffer controls.
Figure 3
Figure 3
HCQ reduced bindings of aPL IgG, increased quantity of AnxA5, and reversed the acceleration of plasma coagulation on cultured HUVECs and STCs. (A) HCQ reduced binding of aPL IgGs to cultured cells. In the absence of HCQ, HUVECs (left panel) exposed to human aPL IgGs (0.5 mg/mL) bound significantly more IgG than with control IgGs (44.2 ± 0.7 AU/well vs 26.9 ± 1.1 AU/well; P < .001); HCQ significantly reduced the binding of aPL IgGs to the surfaces of HUVECs (31.5 ± 5.2 AU/well for HCQ at 1 μg/mL and 27.8 ± 1.8 AU/well for HCQ at 1 mg/mL) to levels that were not significantly different from control IgGs (26.9 ± 1.1 AU/well;P = .19 and P = .50, respectively). Similarly, STCs (right panel) exposed to human aPL IgGs (0.5 mg/mL) bound significantly more IgG than with control IgGs (53.0 ± 4.0 AU/well vs 29.8 ± 1.8 AU/well; P < .001); HCQ significantly reduced the binding of aPL IgGs to the surfaces of STCs (36.2 ± 7.0 AU/well for HCQ at 1 μg/mL and 35.0 ± 6.6 AU/well for HCQ at 1 mg/mL) to levels that were not significantly different from control IgGs (29.8 ± 1.8 AU/well; P = .20 and P = .26, respectively). There were no significant differences between control IgGs in the absence or presence of both concentrations of HCQ (data not shown). As described in “Human umbilical vein endothelial cell cultures” and “STC cultures,” 3 pairs of IgGs from APS patients and controls were used for all of these experiments, done in quadruplicate for each IgG. (B) HCQ increased AnxA5 levels on cultured HUVECs and STCs exposed to aPL IgGs. In the absence of HCQ, aPL reduced AnxA5 levels compared with control IgG (1.2 ± 0.1 ng/well vs 1.9 ± 0.2 ng/well; P = .003); HCQ increased AnxA5 levels on the aPL IgG-treated cells to levels similar to control IgGs (1.8 ± 0.4 ng/well for 1 μg/mL HCQ and 1.9 ± 0.1 ng/well for 1 mg/mL HCQ vs 1.9 ± 0.2 ng/well for control IgG; P = .85 and P = .88, respectively). The same effect was seen with STCs, wherein aPL IgG reduced AnxA5 (2.5 ± 0.4 ng/well vs 4.1 ± 0.7 ng/well for control IgGs; P = .02), and HCQ increased the AnxA5 to levels similar to control IgGs (4.6 ± 1.1 ng/well for 1 μg/mL HCQ and 5.7 ± 0.8 ng/well for 1 mg/mL HCQ vs 4.1 ± 0.7 ng/well; P = .57 and P = .06, respectively). There were no significant differences between control IgGs in the absence or presence of both concentrations of HCQ (data not shown). (C) HCQ reversed the acceleration of coagulation times of plasmas overlaid on cultured HUVECs and STCs exposed to aPL IgGs. The coagulation times of plasma on aPL IgG-treated HUVECs (left panel) were significantly accelerated compared with control IgGs (101 ± 11 seconds vs 135 ± 4 seconds; P = .007). HCQ significantly prolonged them to coagulation times that were not significantly different from control IgGs (130 ± 3 seconds for 1 μg/mL HCQ and 134 ± 13 seconds for 1 mg/mL HCQ vs 135 ± 4 seconds for control IgGs; P = .15 and P = .90, respectively). The same effect was seen with STCs (right panel), wherein the coagulation times of plasma overlaid on aPL IgG-treated cells were significantly accelerated (172 ± 14 seconds vs 231 ± 7 seconds for control IgGs; P = .003). HCQ significantly prolonged them to coagulation times that were not significantly different from control IgGs (256 ± 17 seconds for 1 μg/mL HCQ and 242 ± 3 seconds for 1 mg/mL HCQ vs 231 ± 7 seconds for control IgG; P = .08 and P = .07, respectively). There were no significant differences between control IgGs in the absence or presence of both concentrations of HCQ (data not shown).
Figure 4
Figure 4
Effects of HCQ on AnxA5 anticoagulant activity of plasmas from APS patients. HCQ (1 mg/mL) significantly improved the AnxA5 anticoagulant activities of APS plasmas that were exposed to the same concentration (30 μg/mL) of AnxA5 (183 ± 45% vs 156 ± 33% without HCQ; P < .001). This assay, described in “Effects of HCQ on AnxA5 anticoagulant activity,” and previously, is a coagulation assay that measures the effect of test plasma on the binding of AnxA5 to phospholipids present in a prothrombin time-activated partial thromboplastin time reagent.
Figure 5
Figure 5
End point AFM imaging of effects of HCQ on AnxA5 crystallization. (A) In the absence of HCQ, aPL mAb with β2GPI markedly disrupted the normally smooth AnxA5 crystalline array, as previously described., The dark zones present throughout the image (6 of which are demarcated by ellipses) indicate markedly decreased height measurements that are consistent with exposure of phospholipid bilayer (size range 0.5-2 μm), 6 of which are demarcated by ellipses., (B) Addition of HCQ prevented this marked disruption of AnxA5 crystallization and resulted in a cobbled surface that is entirely covered by patches of AnxA5 (size range 1.5-4.5 μm; 2 of which are demarcated by diamonds).
Figure 6
Figure 6
Dynamic AFM imaging of effects of HCQ on AnxA5 crystallization.(A) The binding of β2GPI to phospholipid bilayer after overnight incubation at 4°C resulted in formation of clusters of the protein. An arrow indicates one of these clusters as a representative reference point for the subsequent sequences. (B) The binding of aPL mAb, IS4, to β2GPI clusters showing the formation of aPL IgG-β2GPI complexes with increased heights and thickening of each of the clusters (arrow). (C) Addition of HCQ and AnxA5 resulted in the erosion of the complexes (arrow), as previously described, and (D) formation of “cobblestones” of Anx A5 that formed over and around the remnants of the aPL mAb-β2GPI complexes (arrow). The appearances of the AnxA5 patches are identical to the formations shown in the endpoint experiment of Figure 5B. All above 15 μm × 15-μm amplitude images were electronically zoomed from an original 30 μm × 30-μm scan.
Figure 7
Figure 7
Dynamic AFM imaging of HCQ-induced formation of formation of AnxA5 layer over aPL IgG-β2GPI complexes. Each original AFM amplitude image (top panel) is paired with a colorized version (bottom panel) for explanation. In a sequence performed without HCQ, (A) the addition of β2GPI to phospholipid bilayers resulted in the formation of clusters (marked 1-4, orange circles in colorized version), as previously described. (B) Addition of AnxA5 resulted in the initiation of 2-dimensional crystallization (flat round structures, green in colorized version) arising from different nucleation points, which (C) enlarge, merge, and grow toward each other, as previously described, until they covered all of the bilayer not occupied by the β2GPI cluster. (D) Subsequently added aPL mAb bound to the surfaces of β2GPI clusters. In a sequence that included HCQ, (E) addition of β2GPI to phospholipid bilayers and formation of β2GPI clusters (marked 1-5) were followed by (F) addition of HCQ, followed by (G) addition of AnxA5, which at first crystallized from multiple different nucleation sites on the phospholipid bilayer, (H) and then formed a secondary layer of AnxA5 over the β2GPI, which progressively grew around and over the adjacent primary layer of AnxA5 crystal, leaving none of the surface uncovered by AnxA5.

Comment in

Similar articles

Cited by

References

    1. Ginsberg JS, Wells PS, Brill Edwards P, et al. Antiphospholipid antibodies and venous thromboembolism. Blood. 1995;86:3685–3691. - PubMed
    1. Out HJ, Bruinse HW, Christiaens GC, et al. Prevalence of antiphospholipid antibodies in patients with fetal loss. Ann Rheum Dis. 1991;50:553–557. - PMC - PubMed
    1. Lim W, Crowther MA, Eikelboom JW. Management of antiphospholipid antibody syndrome: a systematic review. J Am Med Assoc. 2006;295:1050–1057. - PubMed
    1. Rand JH, Wu XX, Quinn AS, Taatjes DJ. Resistance to annexin A5 anticoagulant activity: a thrombogenic mechanism for the antiphospholipid syndrome. Lupus. 2008;17:922–930. - PubMed
    1. Andree HAM, Stuart MC, Hermens WT, et al. Clustering of lipid-bound annexin V may explain its anticoagulant effect. J Biol Chem. 1992;267:17907–17912. - PubMed

Publication types

MeSH terms