. 2010 Feb 11;115(6):1156-65.
doi: 10.1182/blood-2009-07-235382. Epub 2009 Dec 3.

Granzyme B produced by human plasmacytoid dendritic cells suppresses T-cell expansion

Affiliations

Granzyme B produced by human plasmacytoid dendritic cells suppresses T-cell expansion

Bernd Jahrsdörfer et al. Blood. .

Abstract

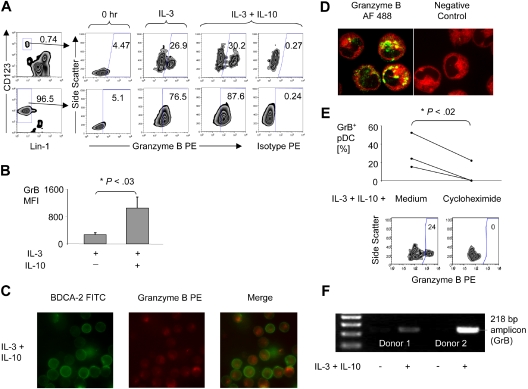
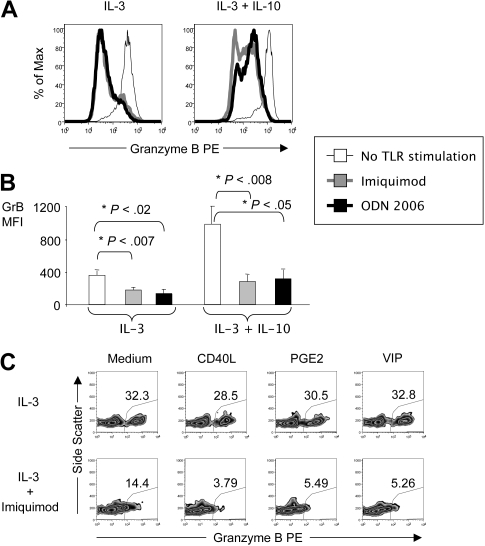
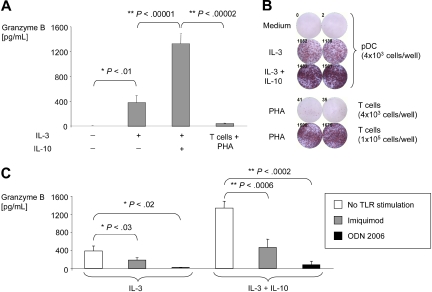
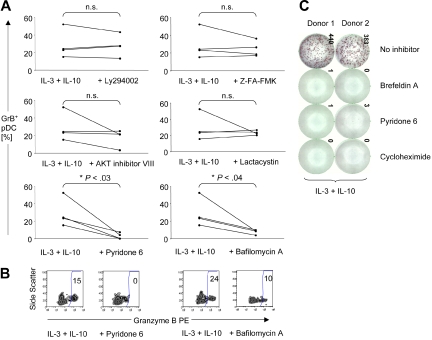
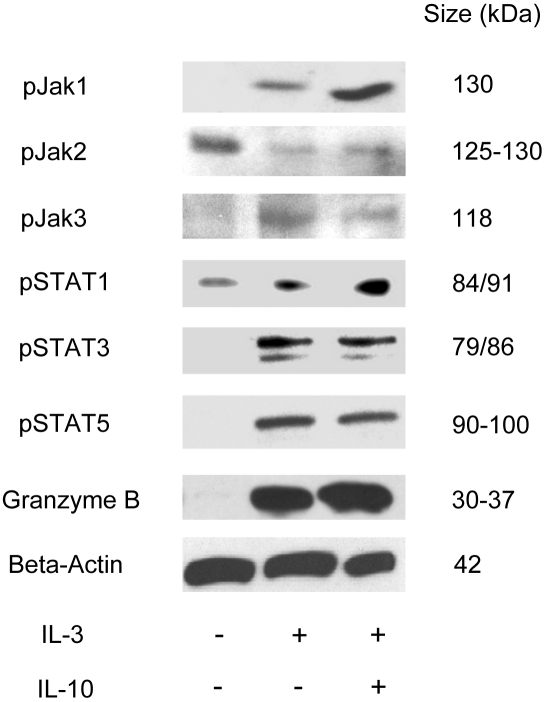
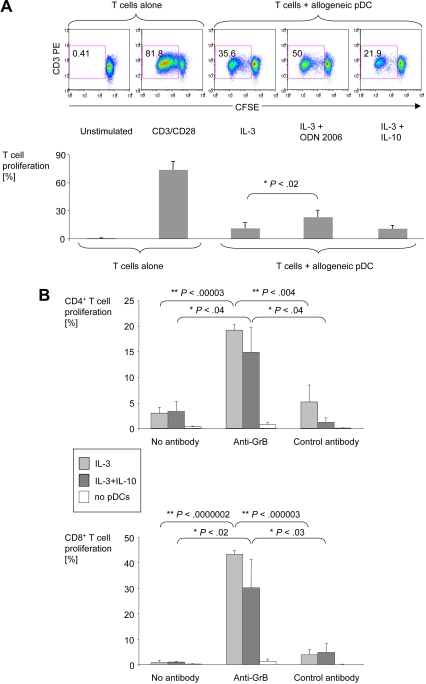
Human plasmacytoid dendritic cells (pDCs) are crucially involved in the modulation of adaptive T-cell responses in the course of neoplastic, viral, and autoimmune disorders. In several of these diseases elevated extracellular levels of the serine protease granzyme B (GrB) are observed. Here we demonstrate that human pDCs can be an abundant source of GrB and that such GrB(+) pDCs potently suppress T-cell proliferation in a GrB-dependent, perforin-independent manner, a process reminiscent of regulatory T cells. Moreover, we show that GrB expression is strictly regulated on a transcriptional level involving Janus kinase 1 (JAK1), signal transducer and activator of transcription 3 (STAT3), and STAT5 and that interleukin-3 (IL-3), a cytokine secreted by activated T cells, plays a central role for GrB induction. Moreover, we find that the immunosuppressive cytokine IL-10 enhances, while Toll-like receptor agonists and CD40 ligand strongly inhibit, GrB secretion by pDCs. GrB-secreting pDCs may play a regulatory role for immune evasion of tumors, antiviral immune responses, and autoimmune processes. Our results provide novel information about the complex network of pDC-T-cell interactions and may contribute to an improvement of prophylactic and therapeutic vaccinations.


Figures

Figure 1
Figure 1
pDCs activated in the presence of IL-3 with or without IL-10 express GrB mRNA and protein. PBMCs or purified pDC precursors (> 90%) were cultured for 16 hours in the presence of IL-3, either with or without IL-10. Freshly prepared unstimulated pDC precursors (0 hour) served as negative controls. (A) Zebra plots show GrB expression in pDCs from unfractionated PBMCs (top panel) or purified pDC preparations (bottom panel) as indicated by gating on the lin-1...CD123high populations. (B) Bar graphs indicate GrB expression as indicated by average median fluorescence intensities (MFI) from 6 independent experiments with purified pDCs. Error bars indicate SEM. (C) Fluorescence microscopy with ×60 magnification was performed with purified IL-3/IL-10–cultured pDCs stained with PE-labeled anti-GrB (orange) and FITC-labeled anti-BDCA-2 (green). (D) Spinning disk confocal microscopy was performed with purified pDCs cultured in the presence or absence of IL-3 and IL-10 and then stained with anti-GrB-biotin and streptavidin–Alexa Fluor 488 (green) as well as Cell Mask deep red membrane stain (red). The negative control shows staining with a biotinylated isotype control instead of anti-GrB-biotin. No green fluorescence was found when pDCs were cultured in the absence of IL-3 and IL-10 (not shown). (E) Line graphs and zebra plots show GrB expression by purified pDCs stimulated with IL-3 and IL-10 in the presence or absence of cycloheximide at 1 μg/mL (n = 3). (F) RT-PCR for GrB mRNA was performed using 6 × 10⁵ and 9 × 10⁵ purified pDCs isolated before (−) and after (+) incubation of pDCs for 16 hours with IL-3 and IL-10.
Figure 2
Figure 2
pDC expression of GrB is negatively regulated by ligands for TLR7, TLR9, and CD40. pDCs were activated for 16 hours in the presence of IL-3 alone or IL-3 and IL-10 as well as the TLR9 ligand ODN 2006 or the TLR7 ligand imiquimod. Then they were stained with fluorescently labeled antibodies to pDC markers and GrB, and analyzed by FACS. (A) Histograms show GrB expression in pDCs from 1 representative donor. (B) Bar graphs illustrate average MFI for GrB expression from 3 independent experiments. (C) Zebra plots from pDCs activated in the presence of IL-3 and combinations of imiquimod with CD40L, PGE2, or VIP illustrate the percentages of GrB+ pDCs (representative for n = 3).
Figure 3
Figure 3
IL-3–activated pDCs secrete large amounts of GrB. Purified pDCs were cultured for 16 hours in the absence or presence of IL-3 with or without IL-10. (A) GrB in supernatants was measured by ELISA. Bar graphs illustrate average GrB concentrations from 5 independent experiments (values normalized to 104 pDCs per well). (B) GrB secretion was determined by a GrB-specific ELISPOT using purified pDCs treated with IL-3 with or without IL-10 or using T cells treated with PHA (positive control). No spots were observed in samples with 4 × 10³ pDCs per well in the presence of PHA (not shown). (C) GrB ELISA was performed from supernatants of purified pDCs treated with ODN 2006 or imiquimod. Bar graphs illustrate GrB concentrations normalized to 104 pDCs per well (n = 10).
Figure 4
Figure 4
pDC expression and secretion of GrB depend on JAK activation, endosomal acidification, and active intracellular transport. pDCs were activated for 16 hours in the presence of IL-3 and IL-10 and various inhibitors. All inhibitors were nontoxic for pDC at the concentrations used. GrB expression in pDCs was analyzed by FACS. (A) Line graphs show GrB expression with and without various inhibitors as measured by intracellular staining for GrB from 4 individual experiments. (B) Zebra plots show GrB expression in pDCs from one representative experiment. (C) GrB secretion by purified pDCs was detected using a specific ELISPOT. Shown are results from 2 representative donors of 4.
Figure 5
Figure 5
Expression of GrB in pDCs is associated with phosphorylation of JAK/STAT members. pDC precursors were purified and evaluated either unstimulated or after stimulation with IL-3 with or without IL-10. Stimulation was performed for 16 hours for GrB detection, 10 minutes for pJAK detection, and 30 minutes for pSTAT detection. Protein was extracted and Western immunoblotting performed. Loading of equal protein amounts was assured by parallel blotting for β-actin. PBMCs stimulated with PHA served as positive controls (data not shown). One representative experiment of 3 is shown.
Figure 6
Figure 6
pDCs matured in the presence of IL-3 and IL-10 deliver enzymatically active GrB to CD4+ T cells. pDCs from healthy donors were purified and cultured for 60 hours in the presence of IL-3 and IL-10. Then, pDC (> 95% purity) were harvested and added to chamber slides containing purified immobilized CD4+ T cells (> 98% purity) stained with Cell Mask deep red membrane dye. Finally, GranToxiLux fluorogenic GrB substrate was added to the chamber slides and cocultures were analyzed for 2.5 hours using spinning disk confocal microscopy. Images were deconvolved using ImageJ software. (A) GrB+ pDCs are displayed in green-yellow, cell membranes in red, and active GrB internalized by immobilized CD4+ T cells in green. No green or yellow fluorescence was found when pDCs were cultured in the absence of IL-3 and IL-10 (not shown). (B) Shown is a sequence of detailed images of 1 individual CD4+ T cell before and during contact to a GrB+ pDCs (blue arrows indicate visible contact). Note the rapid diffusion of active GrB within the T cell after first contact to GrB+ pDCs.
Figure 7
Figure 7
pDC-derived GrB inhibits allogeneic T-cell proliferation. Purified pDCs were activated for 36 hours in the presence of IL-3, IL-10, and ODN 2006 as indicated. Activated pDCs were washed and coincubated for 6 days with CFSE-stained allogeneic T cells at a pDC:T cell ratio of 1:250. Cells were harvested, stained for CD3, CD4, and CD8, and analyzed by 4-color flow cytometry. (A) Dot plots from one representative experiment and bar graphs from 6 independent experiments illustrate the percentage of CD3+ T cells proliferating in response to allogeneic pDCs or anti-CD3/CD28 antibodies. Error bars indicate SEM. Similar responses were obtained with imiquimod instead of ODN 2006 (data not shown). (B) Bar graphs show average percentages of proliferating CD3+CD4+ and CD3+CD8+ T cells in the presence or absence of IL-3 with or without IL-10–cultured pDCs and anti-GrB or control antibodies (both at 50 μg/mL; n = 4). Error bars indicate SEM.

Similar articles

Cited by

References

    1. Gilliet M, Cao W, Liu YJ. Plasmacytoid dendritic cells: sensing nucleic acids in viral infection and autoimmune diseases. Nat Rev Immunol. 2008;8(8):594–606. - PubMed
    1. Colonna M, Trinchieri G, Liu YJ. Plasmacytoid dendritic cells in immunity. Nat Immunol. 2004;5(12):1219–1226. - PubMed
    1. Waldner H. The role of innate immune responses in autoimmune disease development. Autoimmun Rev. 2009;8(5):400–404. - PubMed
    1. Schettini J, Mukherjee P. Physiological role of plasmacytoid dendritic cells and their potential use in cancer immunity. Clin Dev Immunol. 2008;2008:106321. - PMC - PubMed
    1. Liu YJ. IPC: professional type 1 interferon-producing cells and plasmacytoid dendritic cell precursors. Annu Rev Immunol. 2005;23:275–306. - PubMed

Publication types

MeSH terms