. 2010 Jan 21;115(3):530-40.
doi: 10.1182/blood-2009-08-236521. Epub 2009 Nov 12.

Regulating human Th17 cells via differential expression of IL-1 receptor

Affiliations

Regulating human Th17 cells via differential expression of IL-1 receptor

Won-Woo Lee et al. Blood. .

Abstract

In humans, interleukin-1beta (IL-1beta) has been suggested as an essential cytokine for developing IL-17- or IL-17A-producing CD4(+) T helper 17 (Th17) cells. However, little is known about the relationship of IL-1 receptor expression and Th17 cell differentiation. We report here the presence of 2 distinct CD4(+) T-cell populations with and without expression of IL-1RI that correlates with the capacity to produce IL-17 in naive and memory CD4(+) T cells of human peripheral blood. IL-1RI(+) memory CD4(+) T cells had increased gene expression of IL17, RORC, and IRF4 even before T-cell receptor triggering, indicating that the effect of IL-1beta is programmed in these cells via IL-1RI. Although CD4(+) T cells from umbilical cord blood did not express IL-1RI, the cytokines IL-7, IL-15, and transforming growth factor-beta (TGF-beta) up-regulated IL-1RI expression on naive CD4(+) T cells, suggesting that IL-1RI(+) naive CD4(+) T cells develop in periphery. Furthermore, IL-17 production from the cytokine-treated naive CD4(+) T cells was induced by IL-1beta and this induction was blocked by IL-1R antagonist. These results indicate that human Th17 cell differentiation is regulated via differential expression of IL-1RI, which is controlled by IL-7 and IL-15.


Figures

Figure 1
Figure 1
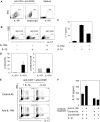
Ex vivo identification of CD4+ T cells with and without IL-1RI expression in healthy human peripheral blood. (A) Flow cytometric analysis of IL-1RI expression on CD4+ T cells. The number on the histogram plot indicates the frequency (%) of IL-1RI+ cells in total CD4+ T cells. (B) Flow cytometric measurement of the frequency (%) of naive (CD45RA+CCR7+), central memory (CM; CD45RACCR7+), and effector memory (EM; CD45RACCR7) cells in IL-1RI+ and IL-1RI CD4+ T cells. Numbers in quadrants indicate the frequency of cells for each quadrant. (C) Flow cytometry of CD28, CD27, and CD62L expression on IL-1RI+ and IL-1R naive, CM, and EM CD4+ T cells. (D) RT-PCR analysis of IL1RI expression in sorted IL-1RI+ and IL-1RI naive and memory (CD45RACCR+/−) CD4+ T cells. Results are relative to the level of expression of β-actin. Data represent the mean ± SEM of 15 (A-B) and 5 (D) donors or 8 separate experiments (C, 1 experiment per donor). *P < .05 using the paired t test.
Figure 2
Figure 2
IL-1RI+ memory CD4+ T cells produce higher levels of IL-17 in response to TCR triggering compared with IL-1RI memory CD4+ T cells. (A) Flow cytometric analysis of IL-1RI expression on IL-17–producing CD4+ T cells. Peripheral blood mononuclear cells were stimulated for 4 hours with PMA and ionomycin (A). Mean fluorescent intensity (MFI) of IL-1RI expression on IL-17+CD4+ (IL-17+) and IL-17CD4+ (IL-17) T cells (A, right). (B-C) Sorted IL-1RI+ and IL-1RI memory CD4+ T cells were stimulated for 7 days (B) or indicated times (C) with anti-CD3/anti-CD28 antibody-coated beads. Cytokine production was determined using intracellular flow cytometry after 4 hours of PMA/ionomycin stimulation (B) or ELISA (C). (D) RT-PCR analysis of Th17-related genes in IL-1RI+ and IL-1RI memory CD4+ T cells that were treated for 7 days as in panel C. Numbers indicate the frequency of cells for each quadrant (B). Data represent the mean ± SEM of 10 (A), 9 (B), and 5 (C-D) donors. *Below the lower limit of detection (15 pg/mL of IL-17). P values were obtained by the paired t test.
Figure 3
Figure 3
IL-1RI+ memory CD4+ T cells are committed to produce IL-17 even before TCR triggering. (A) RT-PCR analysis of IL17, RORC, and IRF4 expression in sorted and unstimulated (resting) IL-1RI+ and IL-1RI memory CD4+ T cells. RT-PCR results are relative to the number of transcripts encoding β-actin. Data represent the mean ± SEM of 5 donors. (B-D) Flow cytometric analysis of CCR4, CCR6, IL-23R, IL-21R, and CD161 expression on IL-1RI+ and IL-1RI memory CD4+ T cells. Representative data from 10 (B-C), or 4 (D) separate experiments (1 experiment per donor).
Figure 4
Figure 4
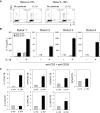
IL-1β promotes IL-17 production from IL-1RI+ and IL-1RI memory CD4+ T cells. (A) ELISA of IL-17 production from sorted IL-1RI+ and IL-1RI memory CD4+ T cells that were incubated for 7 days with anti-CD3 and anti-CD28 antibody-coated beads in the presence or absence of IL-1β. (B) Flow cytometric analysis of intracellular IL-17 and IFN-γ in sorted IL-1RI+ and IL-1RI memory CD4+ T cells that were incubated and stimulated as in panel A followed by 4 hours of PMA and ionomycin stimulation. Numbers in quadrants indicate the frequency of cells for each quadrant. Data represent the mean ± SEM of 5 donors (A) or 7 separate experiments (B, 1 experiment per donor). P values were obtained by the paired t test.
Figure 5
Figure 5
IL-17 production from memory CD4+ T cells can be modulated by the expression of IL-1RI and IL-RII. (A) Flow cytometric analysis of IL-1RI up-regulation on sorted IL-1RI memory CD4+ T cells that were incubated for 3 days in the presence or absence of anti-CD3/CD28 antibody-coated beads. (B) Flow cytometric measurement of intracellular IL-17 in sorted IL-1RI memory CD4+ T cells that were incubated for 2 days with anti-CD3/CD28 antibody-coated beads followed by adding IL-1β and/or IL-1R antagonist (IL-1Ra, 125 ng/mL) and culturing for an additional 5 days. Cells were stimulated for 4 hours with PMA and ionomycin before cytokine analysis. Numbers above boxes in dot plots indicate the frequency of IL-17 cells. MFI indicates the mean fluorescent intensity. (C) ELISA of IL-17 production from sorted IL-1RI memory CD4+ T cells that were incubated and treated as in panel B except for PMA and ionomycin stimulation. (D) RT-PCR of IL1RII and IL1RACP expression in sorted and unstimulated IL-1RI+ and IL-1RI memory CD4+ T cells. Results are relative to the number of transcripts encoding β-actin. (E) Sorted IL-1RI+ memory CD4+ T cells were treated for 2 hours with anti–IL-1RII or isotype control antibodies (20 μg/mL) and incubated for 7 days with anti-CD3/CD28 antibody-coated beads in the presence or absence of IL-1β. Intracellular IL-17 and IFN-γ were assessed using flow cytometry after 4 hours of PMA and ionomycin stimulation. Numbers indicate the frequency of cells for each quadrant. (F) ELISA of IL-17 production from sorted IL-1RI+ memory CD4+ T cells that were treated as in panel E. Data represent 5 (A) and 4 (B,E) independent experiments (1 experiment per donor), mean ± SD of triplicates from 4 independent experiments (C,F) or the mean ± SEM of 5 donors (D).
Figure 6
Figure 6
IL-1RI+ naive CD4+ T cells produce higher levels of IL-17 in response to a combination of IL-1β and TCR triggering. (A) Flow cytometric analysis of intracellular IL-17 and IFN-γ in sorted IL-1RI+ and IL-1RI naive CD4+ T cells that were stimulated for 7 days in serum-free media with anti-CD3/anti-CD28 antibody-coated beads in the presence or absence of IL-1β followed by 16 hours of PMA and ionomycin stimulation. (B) ELISA of IL-17 production from sorted IL-1RI+ and IL-RI naive CD4+ T cells that were stimulated as described in panel A. (C) RT-PCR analysis of Th17-related genes in sorted IL-1RI+ and IL-1RI naive CD4+ T cells that were stimulated as in panel A. Results are relative to the number of transcripts encoding β-actin. Data represent 4 separate experiments (A, 1 experiment per donor) or are from 4 (B) and 3 (C) donors; error bars, mean ± SD (B) or ± SEM (C) of triplicates.
Figure 7
Figure 7
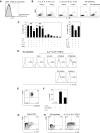
IL-7, IL-15, and TGF-β up-regulate IL-1RI expression on naive CD4+ T cells, leading to enhanced IL-17 production in response to IL-1β and TCR triggering. (A) Flow cytometric analysis of IL-1RI expression on CD4+ T cells in human umbilical cord blood. (B) Flow cytometric analysis of IL-1RI expression on peripheral IL-1RI naive CD4+ T cells that were incubated for 6 days with the common γ chain cytokine cocktail (IL-2, IL-7, IL-15, IL-21) or IL-17 promoting cytokine cocktail (IL-1β, IL-6, IL-21, IL-23) in the presence or absence of TGF-β as well as with anti-CD3 and anti-CD28 antibody-coated beads. (C) Flow cytometric analysis of the induction of IL-1RI expression on IL-1RI naive CD4+ T cells that were incubated for 6 days with different combinations of cytokines in the common γ chain cytokine cocktail and TGF-β. The presence and absence of each cytokine are indicated by + and −, respectively. NS indicates not significant; *P < .05, respectively, by paired t test in comparison of cells treated with the common γC cytokine cocktail. (D) Flow cytometric analysis of IL-1RI expression on IL-1RI naive CD4+ T cells that were treated for 6 days with an inhibitor for AKT (SH-5), JAK1/STAT5 (AG-490), PI3K (LY294002), or MEK1/2 (PD980599) in the presence of IL-7, IL-15, and TGF-β. (E) Flow cytometry of CD45RA and CCR7 expression on IL-1RI naive CD4+ T cells that were incubated with IL-7, IL-15, and TGF-β as in panel C. (F) ELISA of IL-17 production from sorted IL-1RI memory CD4+ T cells that were incubated for 6 days with IL-7, IL-15, and TGF-β followed by washing off the cytokines and an additional 7-day stimulation with anti-CD3 and anti-CD28 antibody-coated beads with or without IL-1β in the presence or absence of IL-1R antagonist (IL-1Ra). (G) Flow cytometric analysis of CD31 and IL-1RI expression on naive CD4+ T cells. (H) Flow cytometric analysis of IL-1RI and CD31 expression on IL-1RI naive CD4+ T cells treated for 6 days with or without IL-7, IL-15, and TGF-β. Data represent 6 (A), 2 (B,D,H) and 4 (E-G) separate experiments (1 experiment per donor) or are from 3 to 5 (C) donors; error bars, mean ± SEM of 3 to 5 experiments (C) or ± SD of triplicates (F). < 15 indicates below the lower limit of detection of IL-17 (15 pg/mL).

Similar articles

Cited by

References

    1. Gaffen SL. An overview of IL-17 function and signaling. Cytokine. 2008;43(3):402–407. - PMC - PubMed
    1. McGeachy MJ, Cua DJ. Th17 cell differentiation: the long and winding road. Immunity. 2008;28(4):445–453. - PubMed
    1. Dong C. TH17 cells in development: an updated view of their molecular identity and genetic programming. Nat Rev Immunol. 2008;8(5):337–348. - PubMed
    1. Bettelli E, Korn T, Oukka M, Kuchroo VK. Induction and effector functions of T(H)17 cells. Nature. 2008;453(7198):1051–1057. - PMC - PubMed
    1. Chen Z, O'Shea JJ. Regulation of IL-17 production in human lymphocytes. Cytokine. 2008;41(2):71–78. - PMC - PubMed

Publication types

MeSH terms