Comparative Study
. 2010 Jan 21;115(3):e10-9.
doi: 10.1182/blood-2009-07-235028. Epub 2009 Nov 12.

Comparison of gene expression profiles between human and mouse monocyte subsets

Affiliations
Comparative Study

Comparison of gene expression profiles between human and mouse monocyte subsets

Molly A Ingersoll et al. Blood. .

Erratum in

  • Blood. 2010 Aug 5;116(5):857

Abstract

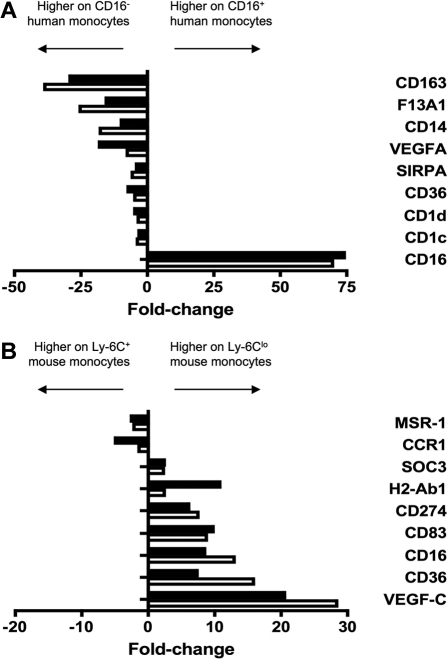
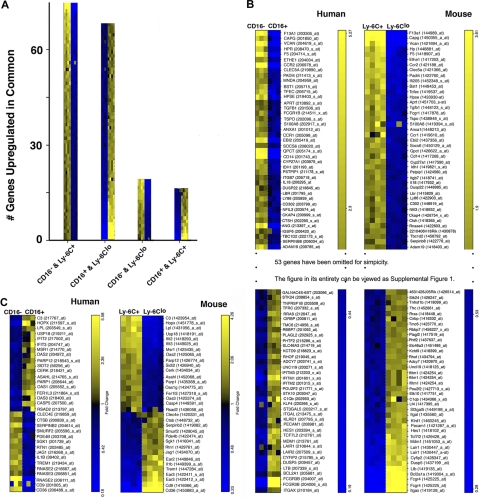
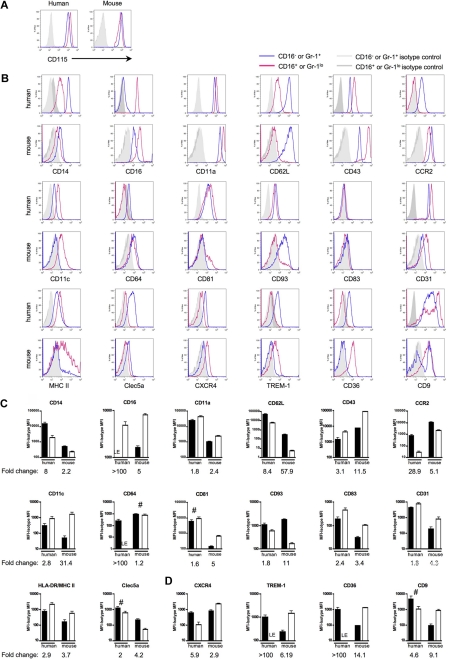
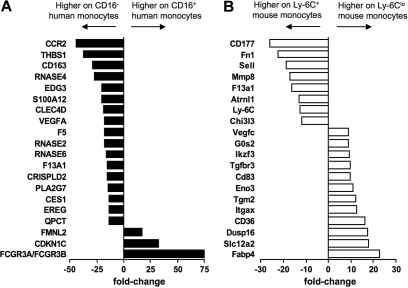
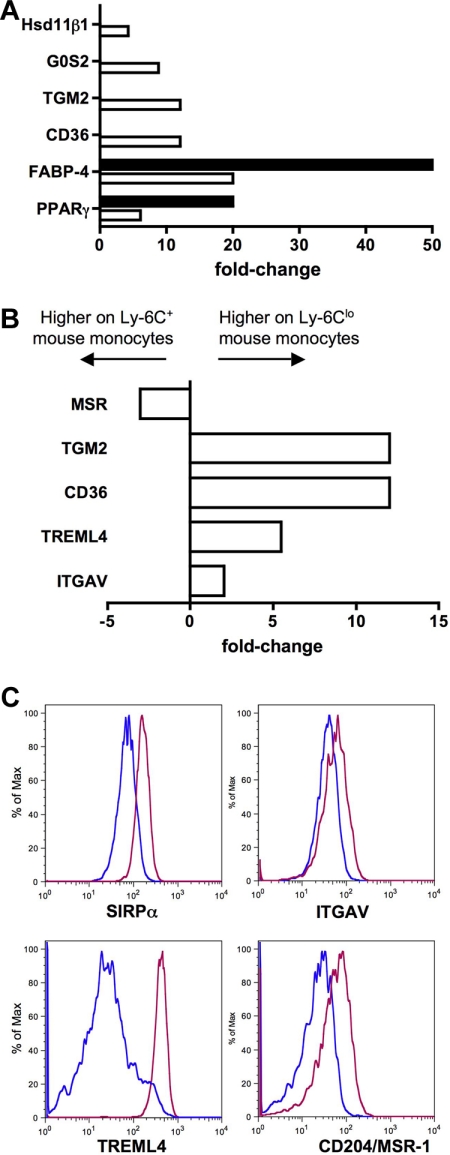
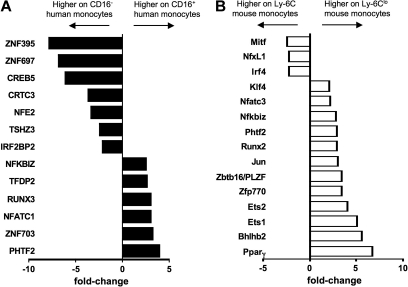
Blood of both humans and mice contains 2 main monocyte subsets. Here, we investigated the extent of their similarity using a microarray approach. Approximately 270 genes in humans and 550 genes in mice were differentially expressed between subsets by 2-fold or more. More than 130 of these gene expression differences were conserved between mouse and human monocyte subsets. We confirmed numerous of these differences at the cell surface protein level. Despite overall conservation, some molecules were conversely expressed between the 2 species' subsets, including CD36, CD9, and TREM-1. Other differences included a prominent peroxisome proliferator-activated receptor gamma (PPARgamma) signature in mouse monocytes, which is absent in humans, and strikingly opposed patterns of receptors involved in uptake of apoptotic cells and other phagocytic cargo between human and mouse monocyte subsets. Thus, whereas human and mouse monocyte subsets are far more broadly conserved than currently recognized, important differences between the species deserve consideration when models of human disease are studied in mice.


Figures

Figure 1
Figure 1
Purification of human and mouse monocyte subsets. (A) Dot plot on the left shows staining of PBMCs for human monocytes before isolation of CD16 and CD16+ subsets. Middle and right dot plots show representative samples of isolated human monocyte subsets, revealing purities of 93% or greater. The purified CD14+CD16++ cells contained 7.5% intermediate monocytes in this example. (B) In mouse whole blood leukocyte preparations, SSC-H voltage was set to exclude a majority of granulocytes and low SSC-H cells were gated (first dot plot). B220+ cells were excluded (second dot plot) and subsequent gating on CD115+ F4/80+ cells selectively identified monocytes (third dot plot). Ly-6C+ and Ly-6Clo monocyte subsets were identified by staining with anti–Gr-1 antibody, which recognizes both Ly-6G and Ly-6C (last dot plot). Only Ly-6C is expressed on monocytes. Ly-6C+/Gr-1+ and Ly-6Clo/Gr-1lo monocyte subset postsort purity was 95% to 97% (not shown).
Figure 2
Figure 2
Verification of human and mouse microarray data. To verify differential expression between monocyte subsets revealed by microarray analysis, 9 genes were amplified from (A) human and (B) mouse monocyte subsets by qPCR. Results from qPCR (■) and microarray (□) are depicted as relative fold change, where negative values are more highly expressed on the CD16 human or Ly-6C+ mouse monocyte subset and positive values are more highly expressed on the CD16+ human or Ly-6Clo mouse subset. qPCR results were in good agreement with microarray data.
Figure 3
Figure 3
Cross-species comparison reveals extensive gene conservation between the species. Outcomes from ordered list algorithm are plotted, with each mRNA pool from 1 hybridization experiment depicted as 1 colored square, with high expression in yellow and low in blue. (A) The number of genes detected by the ordered list algorithm to be up-regulated in common when comparing human CD16 or CD16+ monocytes with mouse Ly-6C+ or Ly-6Clo monocytes. The 2 monocyte subset populations compared are shown on the x-axis under each bar graph. (B) Human and mouse gene lists are arranged to reveal matches of 79 of 132 genes between the species relative to the proposed counterparts of monocyte subsets in the 2 species. Heat map was truncated for simplicity. The entire heat map is presented as supplemental Figure 1 (available on the Blood website; see the Supplemental Materials link at the top of the online article). Data are shown in order of relative differences in gene expression profiles. (C) This panel depicts the 33 probe sets that were identified to be expressed in a pattern converse to the proposed analogy between monocyte subsets.
Figure 4
Figure 4
Human and mouse gene conservation is preserved at the protein level. Pairs of mAbs that recognize proteins encoded by human and mouse orthologs were used to stain human or mouse monocytes. Monocytes were analyzed using the gating strategy shown in Figure 1B. (A) Representative flow plots depict CD115 (M-CSF receptor/c-fms) surface expression on human and mouse monocytes. In human, these results were observed in at least 2 independent experiments and donors. CD115 was routinely used to identify mouse monocytes. (B) Representative flow plots and relevant isotype control staining of quantitative data depicted in panels C and D show differentially expressed human and mouse monocyte subset proteins. (C) Bar graphs portray the mean mean fluorescence intensity (MFI) above background (isotype control MFI was subtracted) and standard deviation of protein expression patterns that reinforce the analogy between CD16 human and Ly-6C+ mouse monocytes or CD16+ human and Ly-6Clo mouse monocytes. (D) Data show protein patterns of expression that are converse in relation to the proposed analogy between CD16 human and Ly-6C+ mouse monocytes or CD16+ human and Ly-6Clo mouse monocytes. (C-D) ■ represent CD16 human or Ly-6G+ mouse monocyte subsets and □ represent CD16+ human or Ly-6Glo mouse monocyte subsets. For proteins marked LE, some donors showed absence of expression, whereas others showed very low expression levels relative to isotype-matched control. Graphs show data from 4 to 12 human donors or 5 to 15 C57BL/6 mice. Quantification of mean fold change between the 2 subsets in each species is indicated below each graph. Unless marked with # (human CD81, Clec5a, CD9, mouse CD64), the difference in protein expression between the 2 subsets within each species is significant; P < .05 for human CD93 and mouse MHC II, and P < .02 for all remaining human and mouse proteins, Student t test.
Figure 5
Figure 5
Human and mouse monocyte subset arrays reveal some divergence from conservation. Bar graphs summarize the top 20 most differentially expressed genes between (A) human (■) and (B) mouse (□) monocyte subsets. Results are depicted as relative fold change, as determined by microarray, where negative values are more highly expressed on the CD16 human or Ly-6C+ mouse monocyte subset and positive values are more highly expressed on the CD16+ human or Ly-6Clo mouse subset.
Figure 6
Figure 6
Ly-6Clo mouse monocytes express gene signatures not found in the human subset counterpart. (A) Bar graph depicts results from qPCR (■) and microarray (□) as relative fold change of PPARγ and PPARγ-regulated genes in mouse monocyte subsets. (B) Bar graph displays results from microarray as relative fold change of genes important for recognition and engulfment of apoptotic cells in mouse monocyte subsets. (C) Protein surface expression of selected proteins from panel B are depicted as representative flow plots. In bar graphs, negative values are more highly expressed on Ly-6C+ mouse monocytes and positive values are more highly expressed on Ly-6Clo monocytes.
Figure 7
Figure 7
Transcription factors not shared between human and mouse monocyte subsets. Bar graph depicts results from microarray as relative fold change of transcriptional regulators in (A) human and (B) mouse monocyte subsets, where negative values are more highly expressed on the CD16 human or Ly-6C+ mouse monocyte subset and positive values are more highly expressed on the CD16+ human or Ly-6Clo mouse subset.

References

    1. Passlick B, Flieger D, Ziegler-Heitbrock HW. Identification and characterization of a novel monocyte subpopulation in human peripheral blood. Blood. 1989;74(7):2527–2534. - PubMed
    1. Ziegler-Heitbrock L. The CD14+ CD16+ blood monocytes: their role in infection and inflammation. J Leukoc Biol. 2007;81(3):584–592. - PubMed
    1. Geissmann F, Jung S, Littman DR. Blood monocytes consist of two principal subsets with distinct migratory properties. Immunity. 2003;19(1):71–82. - PubMed
    1. Sunderkötter C, Nikolic T, Dillon MJ, et al. Subpopulations of mouse blood monocytes differ in maturation stage and inflammatory response. J Immunol. 2004;172(7):4410–4417. - PubMed
    1. Qu C, Edwards EW, Tacke F, et al. Role of CCR8 and other chemokine pathways in the migration of monocyte-derived dendritic cells to lymph nodes. J Exp Med. 2004;200(10):1231–1241. - PMC - PubMed

Publication types