

Foxp1 is an essential transcriptional regulator for the generation of quiescent naive T cells during thymocyte development
- PMID: 19965654
- PMCID: PMC2810984
- DOI: 10.1182/blood-2009-07-232694
Foxp1 is an essential transcriptional regulator for the generation of quiescent naive T cells during thymocyte development
Abstract
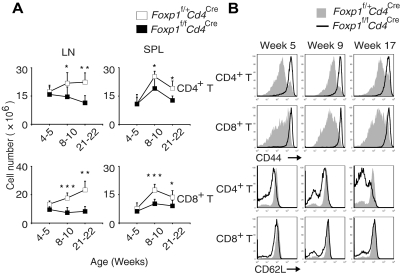
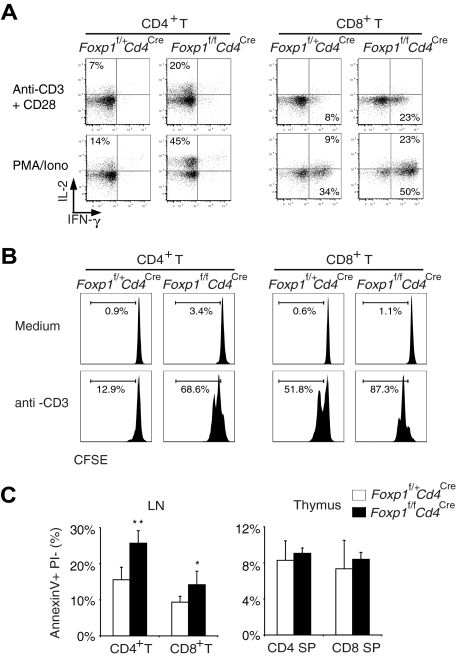
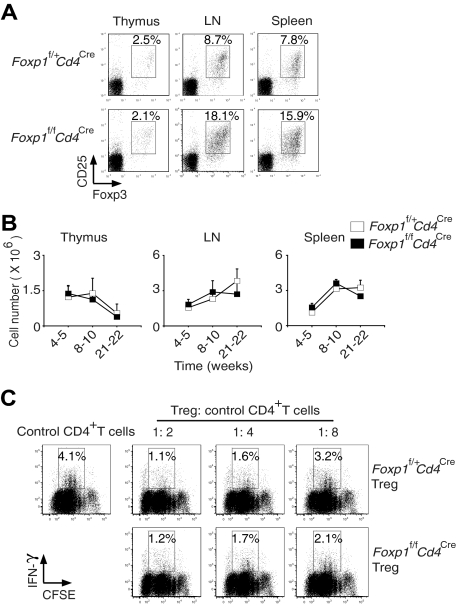
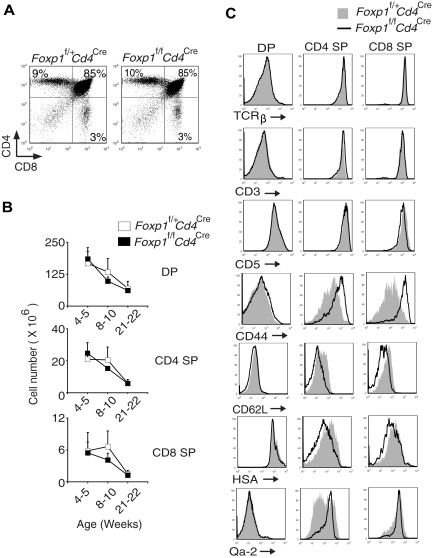
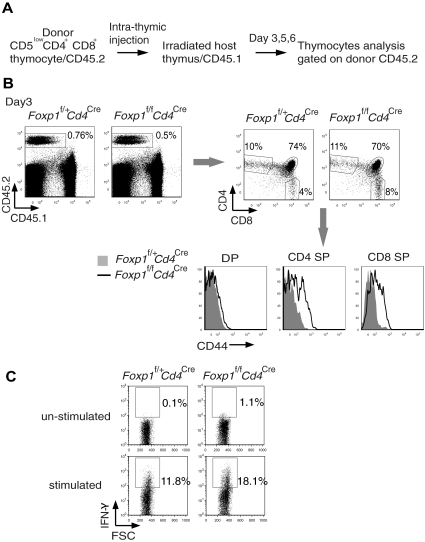
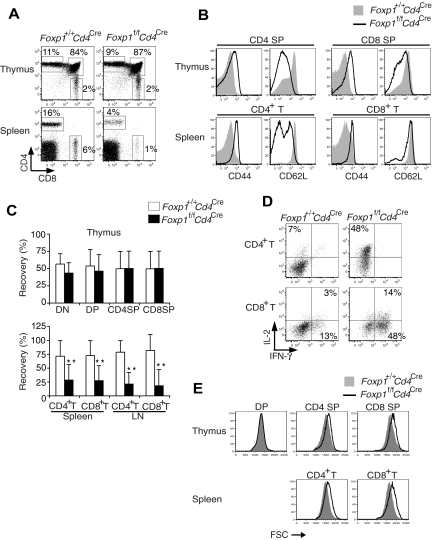
Proper thymocyte development is required to establish T-cell central tolerance and to generate naive T cells, both of which are essential for T-cell homeostasis and a functional immune system. Here we demonstrate that the loss of transcription factor Foxp1 results in the abnormal development of T cells. Instead of generating naive T cells, Foxp1-deficient single-positive thymocytes acquire an activated phenotype prematurely in the thymus and lead to the generation of peripheral CD4(+) T and CD8(+) T cells that exhibit an activated phenotype and increased apoptosis and readily produce cytokines upon T-cell receptor engagement. These results identify Foxp1 as an essential transcriptional regulator for thymocyte development and the generation of quiescent naive T cells.
Figures
Similar articles
-
Transcription factor Foxp1 exerts essential cell-intrinsic regulation of the quiescence of naive T cells.Nat Immunol. 2011 Jun;12(6):544-50. doi: 10.1038/ni.2034. Epub 2011 May 1. Nat Immunol. 2011. PMID: 21532575 Free PMC article.
-
FoxM1, a forkhead transcription factor is a master cell cycle regulator for mouse mature T cells but not double positive thymocytes.PLoS One. 2010 Feb 16;5(2):e9229. doi: 10.1371/journal.pone.0009229. PLoS One. 2010. PMID: 20169079 Free PMC article.
-
The transcription factor Foxp1 is a critical negative regulator of the differentiation of follicular helper T cells.Nat Immunol. 2014 Jul;15(7):667-75. doi: 10.1038/ni.2890. Epub 2014 May 25. Nat Immunol. 2014. PMID: 24859450 Free PMC article.
-
Defective thymocyte maturation by transgenic expression of a truncated form of the T lymphocyte adapter molecule and Fyn substrate, Sin.J Immunol. 2002 Dec 15;169(12):6900-9. doi: 10.4049/jimmunol.169.12.6900. J Immunol. 2002. PMID: 12471123
-
Forkhead transcription factors in immunology.Cell Mol Life Sci. 2005 Feb;62(4):397-409. doi: 10.1007/s00018-004-4365-8. Cell Mol Life Sci. 2005. PMID: 15719167 Free PMC article. Review.
Cited by
-
Foxp1/4 control epithelial cell fate during lung development and regeneration through regulation of anterior gradient 2.Development. 2012 Jul;139(14):2500-9. doi: 10.1242/dev.079699. Epub 2012 Jun 6. Development. 2012. PMID: 22675208 Free PMC article.
-
Whole-exome sequencing supports genetic heterogeneity in childhood apraxia of speech.J Neurodev Disord. 2013 Oct 2;5(1):29. doi: 10.1186/1866-1955-5-29. J Neurodev Disord. 2013. PMID: 24083349 Free PMC article.
-
Transcription factor Foxp1 regulates Foxp3 chromatin binding and coordinates regulatory T cell function.Nat Immunol. 2019 Feb;20(2):232-242. doi: 10.1038/s41590-018-0291-z. Epub 2019 Jan 14. Nat Immunol. 2019. PMID: 30643266 Free PMC article.
-
Transcription factor Foxp1 exerts essential cell-intrinsic regulation of the quiescence of naive T cells.Nat Immunol. 2011 Jun;12(6):544-50. doi: 10.1038/ni.2034. Epub 2011 May 1. Nat Immunol. 2011. PMID: 21532575 Free PMC article.
-
A critical role for the regulated wnt-myc pathway in naive T cell survival.J Immunol. 2015 Jan 1;194(1):158-67. doi: 10.4049/jimmunol.1401238. Epub 2014 Nov 26. J Immunol. 2015. PMID: 25429066 Free PMC article.
References
-
- Starr TK, Jameson SC, Hogquist KA. Positive and negative selection of T cells. Annu Rev Immunol. 2003;21:139–176. - PubMed
-
- Bosselut R. CD4/CD8-lineage differentiation in the thymus: from nuclear effectors to membrane signals. Nat Rev Immunol. 2004;4:529–540. - PubMed
-
- Ramsdell F, Jenkins M, Dinh Q, Fowlkes BJ. The majority of CD4+8- thymocytes are functionally immature. J Immunol. 1991;147:1779–1785. - PubMed
-
- Tzachanis D, Freeman GJ, Hirano N, et al. Tob is a negative regulator of activation that is expressed in anergic and quiescent T cells. Nat Immunol. 2001;2:1174–1182. - PubMed
Publication types
MeSH terms
Substances
Grants and funding
LinkOut - more resources
Full Text Sources
Other Literature Sources
Molecular Biology Databases
Research Materials
