. 2010 Mar 18;115(11):2167-76.
doi: 10.1182/blood-2009-08-238469. Epub 2009 Dec 1.

Regulation of human NK-cell cytokine and chemokine production by target cell recognition

Affiliations

Regulation of human NK-cell cytokine and chemokine production by target cell recognition

Cyril Fauriat et al. Blood. .

Abstract

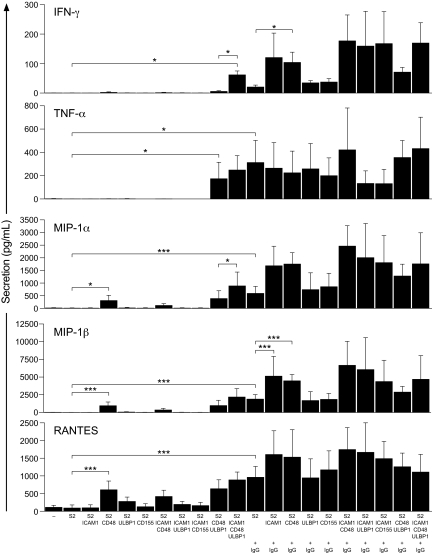
Natural killer (NK)-cell recognition of infected or neoplastic cells can induce cytotoxicity and cytokine secretion. So far, it has been difficult to assess the relative contribution of multiple NK-cell activation receptors to cytokine and chemokine production upon target cell recognition. Using Drosophila cells expressing ligands for the NK-cell receptors LFA-1, NKG2D, DNAM-1, 2B4, and CD16, we studied the minimal requirements for secretion by freshly isolated, human NK cells. Target cell stimulation induced secretion of predominately proinflammatory cytokines and chemokines. Release of chemokines MIP-1alpha, MIP-1beta, and RANTES was induced within 1 hour of stimulation, whereas release of TNF-alpha and IFN-gamma occurred later. Engagement of CD16, 2B4, or NKG2D sufficed for chemokine release, whereas induction of TNF-alpha and IFN-gamma required engagement of additional receptors. Remarkably, our results revealed that, upon target cell recognition, CD56(dim) NK cells were more prominent cytokine and chemokine producers than CD56(bright) NK cells. The present data demonstrate how specific target cell ligands dictate qualitative and temporal aspects of NK-cell cytokine and chemokine responses. Conceptually, the results point to CD56(dim) NK cells as an important source of cytokines and chemokines upon recognition of aberrant cells, producing graded responses depending on the multiplicity of activating receptors engaged.


Figures

Figure 1
Figure 1
Profile and kinetics of NK-cell secretion upon interaction with K562 cells. (A) Resting NK cells were incubated alone or with K562 cells for 6 hours at 37°C. Supernatants were harvested, and the concentrations of indicated cytokines and chemokines were determined by a multiplex immunoassay. Values represent mean ± SD of 8 different donors. (B) NK cells were mixed with K562 cells and incubated at 37°C. Supernatants were harvested at different time points, as indicated, and the concentrations of IFN-γ, TNF-α, MIP-1β, MIP-1β, and RANTES were determined by a multiplex immunoassay. Values represent mean ± SD of 5 different donors.
Figure 2
Figure 2
Minimal requirements for receptor-ligand interactions for secretion of cytokines and chemokines by NK cells. Resting NK cells were mixed with S2 cells expressing ligands for NK-cell receptors, as indicated, and incubated for 6 hours at 37°C. For some stimulations, S2 cells were preincubated with diluted anti–S2 cell serum (+ IgG). Supernatants were harvested, and the concentrations of cytokines and chemokines were determined by a multiplex immunoassay. Values represent mean ± SD of 5 different donors. Data are representative of 3 independent experiments. For clarity, selected statistical analyses are indicated. *P < .05, ***P < .001.
Figure 3
Figure 3
CD56dim NK cells produce cytokines and chemokines upon target cell recognition. Resting NK cells were mixed with S2 cells expressing ligands for NK-cell receptors (A) or K562 cells (B), as indicated, and incubated for 6 hours at 37°C. After stimulation, the cells were surface stained with fluorochrome-conjugated anti-CD56 mAb, fixed, permeabilized, and stained intracellularly with fluorochrome-conjugated mAbs to cytokines and chemokines. The percentage of CD56dim or CD56bright NK cells producing IFN-γ, TNF-α, MIP-1α, and MIP-1β, as indicated, was determined by flow cytometry. Values represent mean ± SD of at least 6 different donors. (C) Sorted CD56dim or CD56bright NK cells were incubated alone or with K562 cells for 6 hours at 37°C. Supernatants were harvested, and the concentrations of cytokines and chemokines were determined by a multiplex immunoassay. Values represent mean ± SD of 5 different donors. (D) Resting NK cells were incubated alone or stimulated with 10 ng/mL IL-12, 100 ng/mL IL-15, or 100 ng/mL IL-18, or combinations thereof, for 24 hours at 37°C. After stimulation, the cells were surface stained with fluorochrome-conjugated anti-CD56 mAb, fixed, permeabilized, and stained intracellularly with fluorochrome-conjugated mAbs to cytokines and chemokines. The percentage of CD56dim or CD56bright NK cells producing IFN-γ, TNF-α, MIP-1α, and MIP-1β, as indicated, was determined by flow cytometry. Values represent mean ± SD of 5 different donors. For clarity, selected statistical analyses are indicated. *P < .05, **P < .01, ***P < .001.
Figure 4
Figure 4
Costimulation of NK cells by exogenous cytokines enhances cytokine production by CD56dim NK cells upon interaction with K562 cells. Resting NK cells were incubated alone or stimulated with cytokines IL-12 and IL-18 (10 ng/mL and 100 ng/mL, respectively) for 6 hours at 37°C with or without K562 cells. After stimulation, the cells were surface stained with fluorochrome-conjugated anti-CD56 mAb, fixed, permeabilized, and stained intracellularly with fluorochrome-conjugated mAbs to cytokines and chemokines. The percentage of CD56dim or CD56bright NK cells producing IFN-γ, TNF-α, MIP-1α, and MIP-1β, as indicated, was determined by flow cytometry. Values represent mean ± SD of 7 different donors. For clarity, selected statistical analyses are indicated. *P < .05, **P < .01, ***P < .001.
Figure 5
Figure 5
Increasing activating ligand density on target cells augments the frequency of cytokine- and chemokine-producing CD56dim NK cells. Before mixing with NK cells, S2 cells expressing ligands for NK-cell receptors, as indicated, were preincubated with serial dilutions of anti–S2 cell serum. Resting NK cells were incubated with S2 cells for 6 hours at 37°C. After stimulation, the cells were surface stained with fluorochrome-conjugated anti-CD56 mAb, fixed, permeabilized, and stained intracellularly with fluorochrome-conjugated mAbs to cytokines and chemokines. The percentage of CD56dim NK cells producing IFN-γ, TNF-α, MIP-1α, and MIP-1β, as indicated, was determined by flow cytometry. Values represent mean ± SD of 3 different donors.
Figure 6
Figure 6
Interrelationships between different NK-cell responses induced by target cell recognition. Resting NK cells were mixed with S2 cells expressing ligands for NK-cell receptors, as indicated, and incubated for 6 hours at 37°C. For some stimulations, S2 cells were preincubated with diluted anti–S2 cell serum (+ IgG). After stimulation, the cells were surface stained with fluorochrome-conjugated anti-CD56 and anti-CD107a mAbs, fixed, permeabilized, and stained intracellularly with fluorochrome-conjugated mAbs to cytokines and chemokines. (A) Lymphocytes were gated on forward scatter height (FSC-H) versus side scatter height plots (SSC-H). Single-cell events were gated on forward scatter height (FSC-H) versus forward scatter area plots (FSC-A). CD56dim NK cells were gated on CD56 versus dead cell marker (DCM) plots. The second and third rows show MIP-1α, TNF-α, IFN-γ, and CD107a staining in relation to MIP-1β staining after stimulation with S2 cells, as indicated. The bottom row shows MIP-1β, MIP-1α, TNF-α, and IFN-γ staining in relation to CD107a staining, and IFN-γ staining in relation to TNF-α staining (right panel). Gates were set using fluorochrome-conjugated isotype control mAbs. The plots are derived from one representative donor. (B) CD56dim NK cells were gated as described in panel A, and a Boolean gating strategy was used for analysis. Pie charts represent the frequency of cells positive for the given number of measured responses (MIP-1β, TNF-α, IFN-γ, and CD107a). Thus, cells can be categorized into the number of responses they display. Arcs depict the relative frequency of cells specifically positive for MIP-1β, TNF-α, IFN-γ, and/or CD107a staining, as indicated. Values represent the mean of 6 different donors.
Figure 7
Figure 7
Schematic representation of activation thresholds and kinetics of resting CD56dim NK-cell responses. (A) Approximate times required for induction of different NK-cell responses such as degranulation (surface expression of CD107a), chemokine secretion (MIP-1α and MIP-1β), and cytokine secretion (IFN-γ and TNF-α) are indicated on the time scale. (B) The figure depicts the relative signal strength required for induction of different NK-cell responses such as degranulation (surface expression of CD107a), chemokine secretion (MIP-1α and MIP-1β), and cytokine secretion (IFN-γ and TNF-α).

Comment in

Similar articles

Cited by

References

    1. Lanier LL. NK cell recognition. Annu Rev Immunol. 2005;23:225–274. - PubMed
    1. Bottino C, Castriconi R, Moretta L, Moretta A. Cellular ligands of activating NK receptors. Trends Immunol. 2005;26(4):221–226. - PubMed
    1. Bryceson YT, March ME, Ljunggren HG, Long EO. Activation, coactivation, and costimulation of resting human natural killer cells. Immunol Rev. 2006;214(1):73–91. - PMC - PubMed
    1. Lodoen MB, Lanier LL. Natural killer cells as an initial defense against pathogens. Curr Opin Immunol. 2006;18(4):391–398. - PMC - PubMed
    1. Lee SH, Miyagi T, Biron CA. Keeping NK cells in highly regulated antiviral warfare. Trends Immunol. 2007;28(6):252–259. - PubMed

Publication types