. 2010 Mar 19;285(12):9124-36.
doi: 10.1074/jbc.M109.071266. Epub 2009 Dec 4.

Potassium channel modulation by a toxin domain in matrix metalloprotease 23

Affiliations

Potassium channel modulation by a toxin domain in matrix metalloprotease 23

Srikant Rangaraju et al. J Biol Chem. .

Abstract

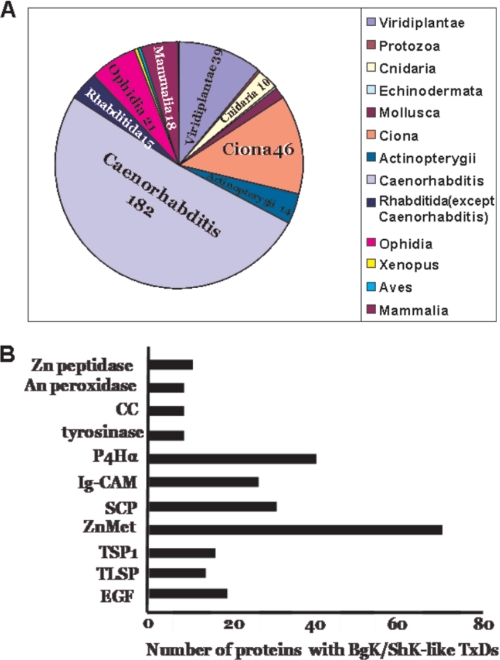
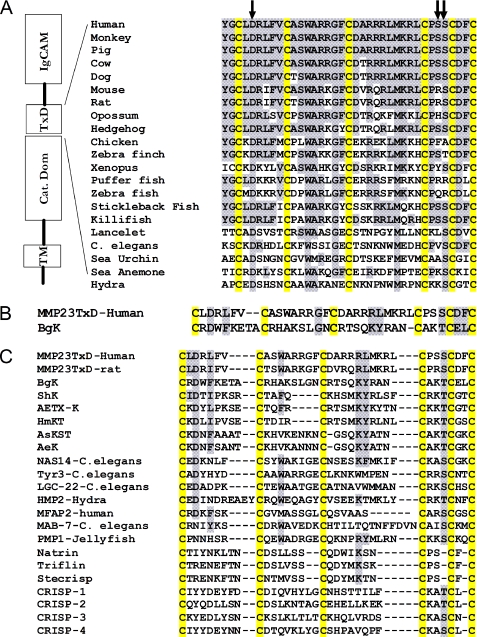
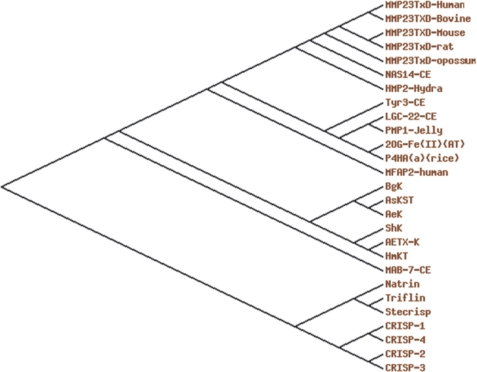
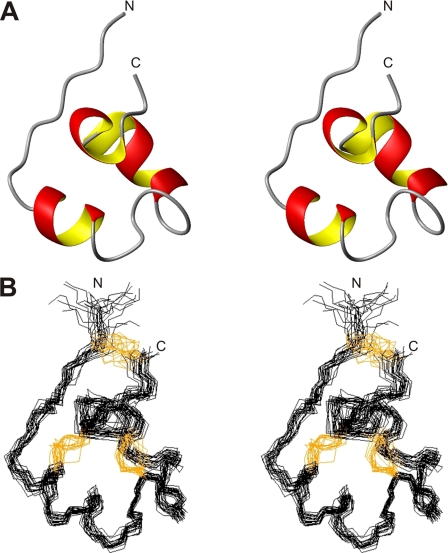
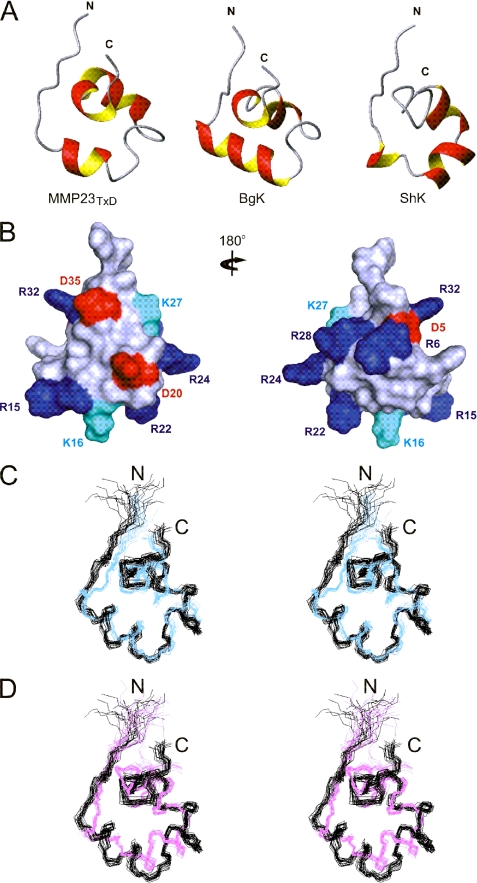
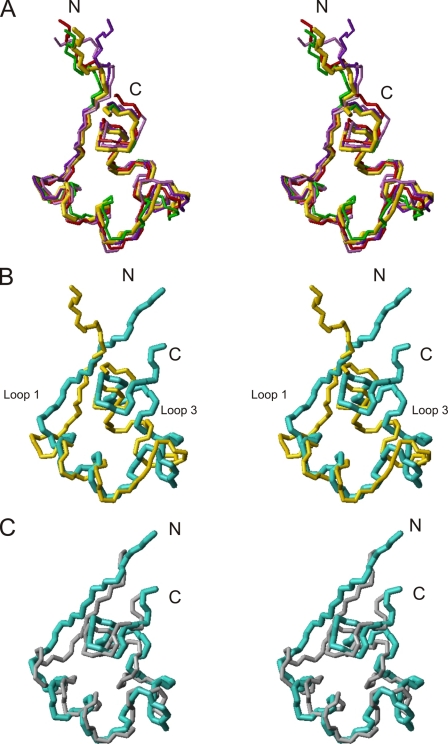
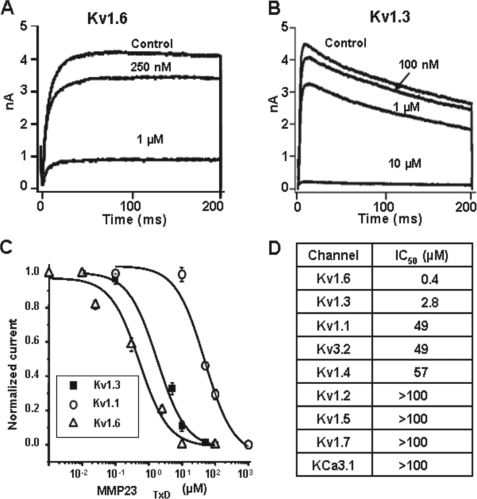
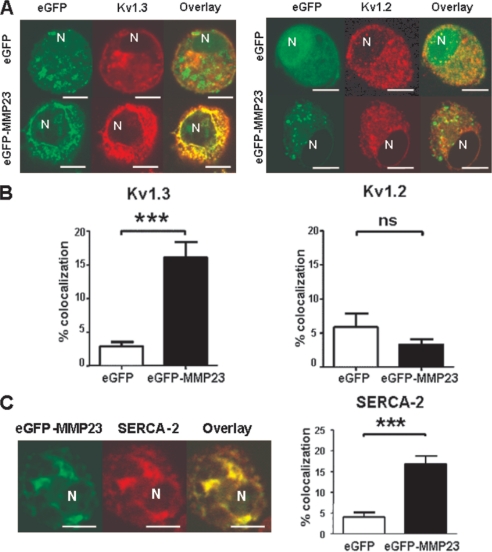
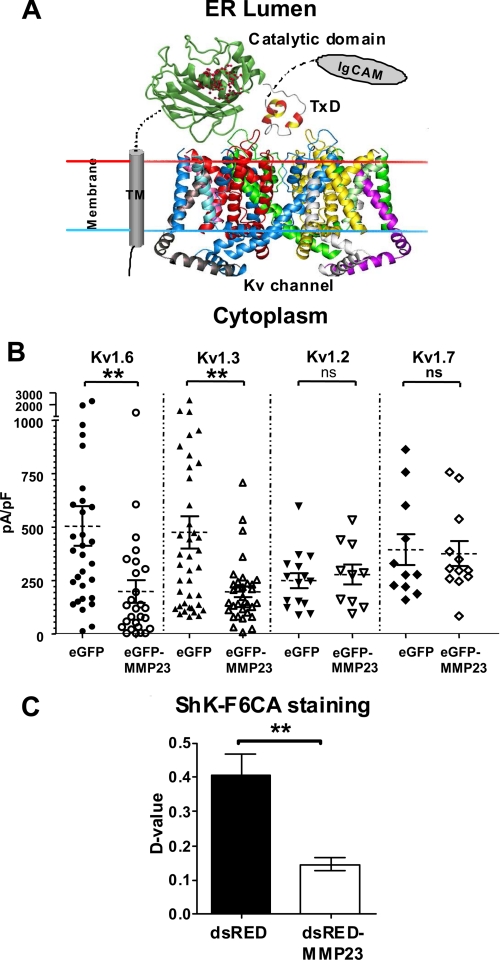
Peptide toxins found in a wide array of venoms block K(+) channels, causing profound physiological and pathological effects. Here we describe the first functional K(+) channel-blocking toxin domain in a mammalian protein. MMP23 (matrix metalloprotease 23) contains a domain (MMP23(TxD)) that is evolutionarily related to peptide toxins from sea anemones. MMP23(TxD) shows close structural similarity to the sea anemone toxins BgK and ShK. Moreover, this domain blocks K(+) channels in the nanomolar to low micromolar range (Kv1.6 > Kv1.3 > Kv1.1 = Kv3.2 > Kv1.4, in decreasing order of potency) while sparing other K(+) channels (Kv1.2, Kv1.5, Kv1.7, and KCa3.1). Full-length MMP23 suppresses K(+) channels by co-localizing with and trapping MMP23(TxD)-sensitive channels in the ER. Our results provide clues to the structure and function of the vast family of proteins that contain domains related to sea anemone toxins. Evolutionary pressure to maintain a channel-modulatory function may contribute to the conservation of this domain throughout the plant and animal kingdoms.


Figures

FIGURE 1.
FIGURE 1.
The ShKT domain protein superfamily. A, distribution of ShKT domains in the plant and animal kingdoms. Viridiplantae, Arabidopsis thaliana, Oryza sativa, and green alga Ostreococcus sp.; Protozoa, Cryptosporidium parvum; Cnidaria, sea anemones, hydra, and jellyfish; Echinodermata, sea urchin; Mollusca, includes bivalve clams and oysters; Ciona, sea squirt Ciona intestinalis; Actinopterygii, includes zebrafish Danio rerio and pufferfish Takifugu rubripes; Caenorhabditis, C. elegans and Caenorhabditis brigssae; Rhabditida, rhabditid nematodes other than Caenorhabditis sp.; Ophidia, snakes; Xenopus, Xenopus tropicalis; Aves, chicken Gallus gallus; Mammalia, kingdom mammalia. Data were generated from the SMART data base at the EMBL-Heidelberg. B, types of proteins containing ShKT domains. These include zinc peptidases (Zn peptidase), animal peroxidases (An peroxidase), coiled-coil regions (CC), tyrosinases, prolyl-4-hydroxylases (P4Hα), IgCAM domains, sperm-coating glycoprotein domains (SCP), zinc metalloproteases (ZnMet), thrombospondin type 1 repeats (TSP1), trypsin-like serine proteases (TLSP), and epidermal growth factor-like domains (EGF).
FIGURE 2.
FIGURE 2.
MMP23 aligned with sea anemone toxins, representative ShKT domains, and ICR domains of CRISPs. A, schematic diagram of MMP23 showing MMP23TxD sandwiched between the metalloprotease and IgCAM domains. A multiple protein sequence alignment of MMP23TxDs from diverse species is shown. Cysteine residues are highlighted in yellow. Identical or synonymous sequences are highlighted in gray. The arrows point to Asp5, Ser32, and Ser33. B, protein sequence alignment of human MMP23TxD and BgK. C, multiple sequence alignment of representative ShKT domains together with the ICR domains of CRISPs. Cysteine residues are highlighted in yellow. Identical or synonymous sequences are highlighted in gray. Sea anemone toxins include BgK (accession number P29186), ShK (accession number P29187), AeTX-K (accession number Q0EAE5), AsKS (accession number Q9TWG1), AeK (accession number P81897), and HmKT (accession number O16846). NAS14-C. elegans, nematode astacin metalloprotease NAS14 (accession number Q19269). Tyr3-C. elegans, tyrosinase 3 (accession number Q19673). LGC-22-C. elegans, ligand-gated channel 22 (accession number NP_500538). HMP2-Hydra, Hydra metalloprotease 2 (accession number AAD33860). MFAP2-human, microfibril associated protein 2 (accession number P55001). MAB-7, male abnormal protein 7 (accession number NP_508174). PMP1-Jellyfish, Podocoryne metalloproteinase 1 (58).
FIGURE 3.
FIGURE 3.
Evolutionary relationships of MMP23TxD with sea anemone toxins, ShKT domains, and ICR domains of CRISPs. A phylogenetic tree (PHYLIP) was generated using the alignment in Fig. 2C and the GeneBee Molecular Biology Servers Tree Top Phylogenetic tree prediction algorithm. In addition to the protein sequences used in the multiple sequence alignment in Fig. 2C, two plant proteins are included in the phylogenetic tree: oxidoreductase, 2OG-Fe(II) oxygenase family protein from A. thaliana (accession number NP_189490) and prolyl-4-hydroxylase α-subunit, O. sativa japonica group (accession number AAT77286).
FIGURE 4.
FIGURE 4.
Synthesis of MMP23TxD peptide. A, RP-HPLC profile after 24 h of oxidative folding. A gradient of 5–95% B in 45 min was used (1.5 ml/min), where A is 0.1% trifluoroacetic acid in water and B is 0.1% trifluoroacetic acid in acetonitrile. Peak 3 is MMP23TxD. B, purified MMP23TxD RP-HPLC profile with the same gradient parameters. Peak 4 is the correctly folded material. C, electrospray mass spectrum of MMP23TxD with M + 5 = 885, M + 4 = 1108, M + 3 = 1475, and M + 2 = 2213 peaks indicated. AU, absorbance units.
FIGURE 5.
FIGURE 5.
Structure of MMP23TxD. A, stereo views of closest to average structure of MMP23TxD in ribbon form showing secondary structure. N and C, N and C termini, respectively. B, family of 20 final structures superimposed over backbone heavy atoms (N, Cα, C′) over all residues with disulfide bonds shown in orange.
FIGURE 6.
FIGURE 6.
Comparison of structures of MMP23TxD and sea anemone K+ channel blockers. A, closest to average structure of MMP23TxD displayed in ribbon form using MolMol to depict the secondary structure and compared with that of BgK (Protein Data Bank 1BGK) and ShK (Protein Data Bank 1ROO). N and C, N and C termini, respectively. B, surface representation of MMP23TxD generated using PyMOL. The surface is colored with basic residues in blue (Arg in dark blue and Lys in light blue) and acidic residues in red. The two views are related by a 180° rotation about the vertical axis. C, stereo view of MMP23TxD (black) superimposed with BgK (blue) over backbone heavy atoms over aligned and well defined residues (residues 4–9, 10–28, and 30–36 for MMP23TxD with residues 3–8, 11–29, and 30–36 for BgK) (group global r.m.s. deviation 2.13 Å). D, stereo view of MMP23TxD (black) superimposed with ShK (purple) over backbone heavy atoms (residues 4–9, 10–14, and 19–36 for MMP23TxD with residues 4–9, 12–16, and 17–34 of ShK) (group global r.m.s. deviation 2.67 Å). Group global r.m.s. deviations are calculated from average pairwise r.m.s. deviations between each ensemble of final structures.
FIGURE 7.
FIGURE 7.
Comparison with CRISP domain structures. A, superposition of CRISP domains: stecrisp (yellow) (Protein Data Bank code 1RC9), natrin (red) (Protein Data Bank code 1XTA), triflin (purple) (Protein Data Bank code 1WVR), CRISP-2/Tpx-1 (violet) (Protein Data Bank code 2A05), and PsTx (green) (Protein Data Bank code 2DDA). N and C, N and C termini, respectively. B, superposition of closest to average structure of MMP23TxD (light blue) and stecrisp (yellow) (global r.m.s. deviation 3.07 Å). C, superposition of closest to average structure of MMP23TxD (light blue) and BgK (gray) (global r.m.s. deviation 2.28 Å). In all cases, structures were superimposed over backbone heavy atoms.
FIGURE 8.
FIGURE 8.
MMP23TxD blocks Kv1.3 channels. A, whole-cell patch clamp Kv1.6 current trace showing dose-dependent block of Kv1.6 channels by MMP23TxD. B, whole-cell patch clamp Kv1.3 current trace showing dose-dependent block of Kv1.3 channels by MMP23TxD. C, dose-response curves for Kv1.3, Kv1.6, and Kv1.1 channels blocked by MMP23TxD; n = 3–5 for each data point. D, table showing IC50 values ± S.D. for respective channel block; n = 4–5 for each value.
FIGURE 9.
FIGURE 9.
MMP23 colocalizes with Kv1.3 in the ER. MMP23 co-localizes with MMP23TxD-sensitive Kv1 channels and with ER marker SERCA-2. A, eGFP-MMP23 (green) co-localizes with Kv1.3 channels (red) but not with Kv1.2 (red); eGFP did not co-localize with either channel. B, quantification of co-localization between eGFP or eGFP-MMP23 with Kv1.3 or Kv1.2 (white bar, n = 25 cells; black bar, n = 30 cells) (*, p < 0.05; **, p < 0.01; ***, p < 0.001; ns, not significant). C, eGFP-MMP23 (green) co-localizes with ER membrane marker SERCA-2 (red). Areas of co-localization are shown in yellow in the overlay image. eGFP does not co-localize with SERCA-2. N, nucleus.
FIGURE 10.
FIGURE 10.
Full-length MMP23 suppresses Kv1 channels by decreasing cell surface expression. A, proposed orientation of MMP23 and Kv1 channels in the ER. The crystal structure of Kv1.2 (Protein Data Bank code 2a79) was used in this diagram because it is the only mammalian Kv1 channel for which a three-dimensional structure has been determined (62). Furthermore, its topology, particularly in the external vestibule where toxins bind, is similar to that of other Kv1 channels. In our depiction of MMP23, the transmembrane segment traverses the ER membrane; the metalloprotease domain (portrayed by the MMP3 catalytic domain structure, Protein Data Bank code 2jnp) lies within the ER lumen; and MMP23TxD is positioned in close proximity to the outer vestibule of the Kv1 channel. B, Kv1.6, Kv1.3, Kv1.2, and Kv1.7 current densities in the presence of eGFP (control) or eGFP-MMP23. Kv1.3 and Kv1.2 were stably expressed in L929-fibroblasts, whereas Kv1.6 and Kv1.7 were transiently expressed in COS7 cells. Scatter diagrams represent pooled data from 3–4 independent experiments. *, p < 0.05; **, p < 0.01; ***, p < 0.001; ns, not significant). C, pDSRED-MMP23 reduced ShK-F6CA staining of cell surface Kv1.3 channels as compared with pDSRED-C1 monomer in COS7 cells. The D value is a measure of the difference in fluorescence intensities of stained and unstained cells (n = 5 experiments, p < 0.05).

Similar articles

Cited by

References

    1. Aiyar J., Withka J. M., Rizzi J. P., Singleton D. H., Andrews G. C., Lin W., Boyd J., Hanson D. C., Simon M., Dethlefs B., Gutman G. A., Chandy K. G. (1995) Neuron 15, 1169–1181 - PubMed
    1. MacKinnon R., Cohen S. L., Kuo A., Lee A., Chait B. T. (1998) Science 280, 106–109 - PubMed
    1. Fry B. G. (2005) Genome Res. 15, 403–420 - PMC - PubMed
    1. Ohno M., Menez R., Ogawa T., Danse J. M., Shimohigashi Y., Fromen C., Ducancel F., Zinn-Justin S., Le Du M. H., Boulain J. C., Tamiya T., Menez A. (1998) Prog. Nucleic Acids Res. Mol. Biol. 59, 307–364 - PubMed
    1. Cousin X., Bon S., Massoulié J., Bon C. (1998) J. Biol. Chem. 273, 9812–9820 - PubMed

Publication types