. 2010 Feb 5;285(6):4060-4073.
doi: 10.1074/jbc.M109.056523. Epub 2009 Dec 4.

Tumor necrosis factor-alpha regulates transforming growth factor-beta-dependent epithelial-mesenchymal transition by promoting hyaluronan-CD44-moesin interaction

Affiliations

Tumor necrosis factor-alpha regulates transforming growth factor-beta-dependent epithelial-mesenchymal transition by promoting hyaluronan-CD44-moesin interaction

Eri Takahashi et al. J Biol Chem. .

Abstract

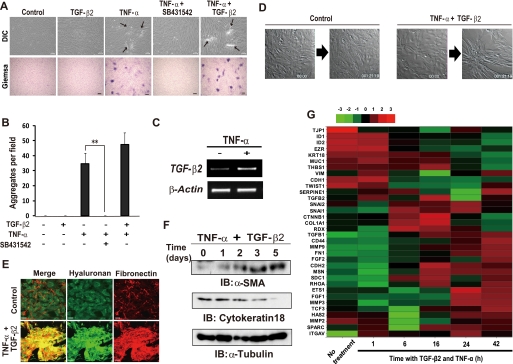
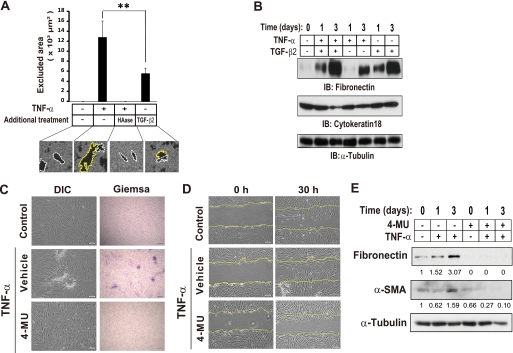
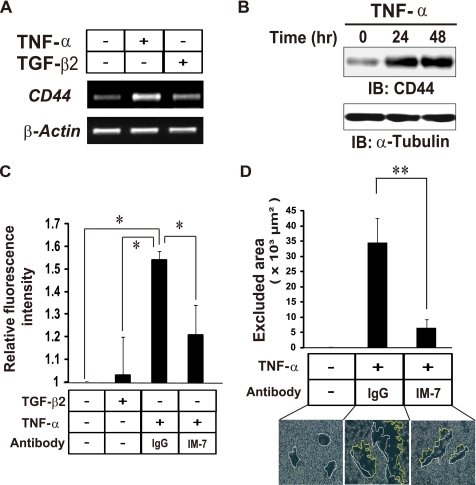
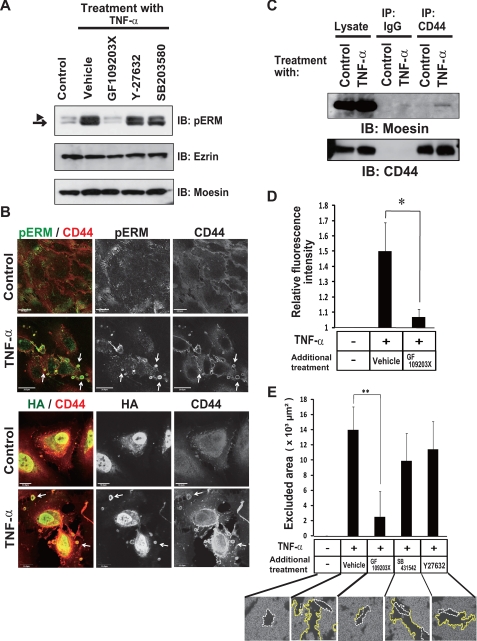
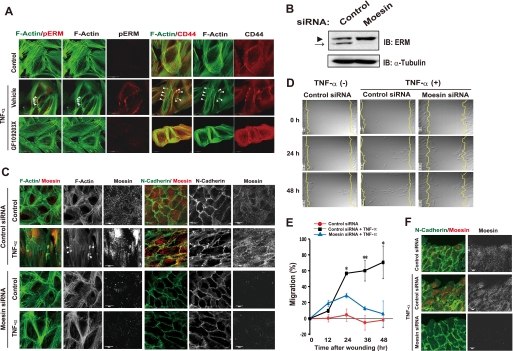
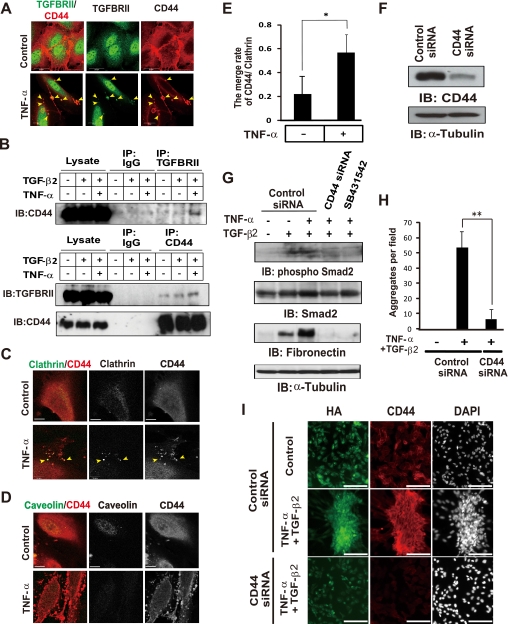
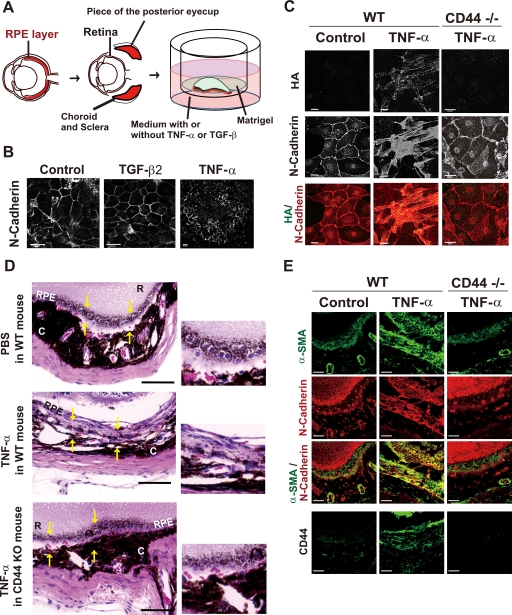
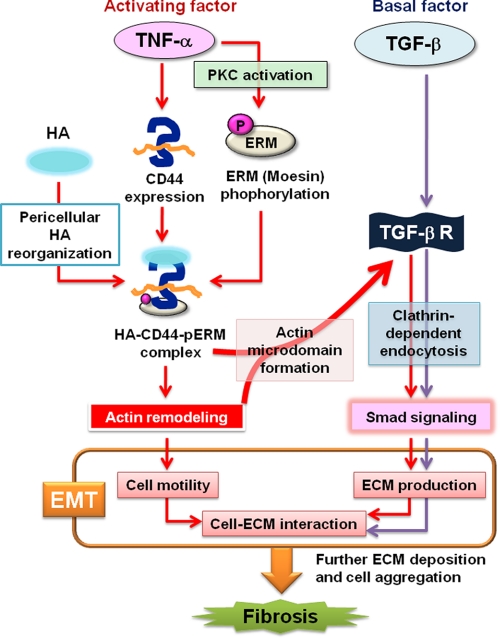
Aberrant epithelial-mesenchymal transition (EMT) is involved in development of fibrotic disorders and cancer invasion. Alterations of cell-extracellular matrix interaction also contribute to those pathological conditions. However, the functional interplay between EMT and cell-extracellular matrix interactions remains poorly understood. We now show that the inflammatory mediator tumor necrosis factor-alpha (TNF-alpha) induces the formation of fibrotic foci by cultured retinal pigment epithelial cells through activation of transforming growth factor-beta (TGF-beta) signaling in a manner dependent on hyaluronan-CD44-moesin interaction. TNF-alpha promoted CD44 expression and moesin phosphorylation by protein kinase C, leading to the pericellular interaction of hyaluronan and CD44. Formation of the hyaluronan-CD44-moesin complex resulted in both cell-cell dissociation and increased cellular motility through actin remodeling. Furthermore, this complex was found to be associated with TGF-beta receptor II and clathrin at actin microdomains, leading to activation of TGF-beta signaling. We established an in vivo model of TNF-alpha-induced fibrosis in the mouse eye, and such ocular fibrosis was attenuated in CD44-null mice. The production of hyaluronan and its interaction with CD44, thus, play an essential role in TNF-alpha-induced EMT and are potential therapeutic targets in fibrotic disorders.


Figures

FIGURE 1.
FIGURE 1.
TNF-α and TGF-β2 interdependently promote the formation of EAFDs by ARPE-19 cells. A, confluent cells were cultured for 4 days in the absence (Control) or presence of TNF-α (10 ng/ml), TGF-β2 (5 ng/ml), or 10 μm SB431542, an inhibitor of TGF-β receptor I, as indicated. The cells were then either examined by DIC microscopy or fixed and subjected to Giemsa staining. Arrows indicate piled-up cell aggregates. Scale bars, 100 μm (upper panels) or 300 μm (lower panels). B, the cell aggregates detected by Giemsa staining in experiments shown in A were counted by microscopic observation. Data are the means ± S.D. for 12 different fields in each of three independent experiments. **, p < 0.01 (Student's t test). C, cells were cultured in the absence or presence of TNF-α for 24 h, after which the abundance of TGF-β2 and β-actin (control) mRNAs was determined by RT-PCR analysis. D, cells were seeded on glass-bottom plates, incubated in the absence or presence of TNF-α and TGF-β2 in serum-free medium, and observed by time-lapse DIC microscopy (see supplemental Movies 1 and 2). Still images of the cells at times 0 and 45 h 19 min are shown. E, confluent cells cultured with or without both TNF-α and TGF-β2 for 48 h were subjected to fluorescence staining with HA binding protein for HA and with antibody to fibronectin. Merged images are also shown. Scale bars, 50 μm. F, cells were cultured in the presence of both TNF-α and TGF-β2 for the indicated times, after which cell lysates were prepared and subjected to immunoblot analysis (IB) with antibodies to α-SMA, cytokeratin 18, or α-tubulin (loading control). G, cells were incubated in the absence or presence of both TNF-α and TGF-β2 for the indicated times (hours), after which total RNA was extracted and subjected to microarray analysis. A cluster heat map for EMT-related genes (see supplemental Table 1) is shown. Red and green denote higher and lower relative expression, respectively; the degree of color saturation reflects the magnitude of the log expression signal according to the indicated scale.
FIGURE 2.
FIGURE 2.
HA synthesis is required for TNF-α-induced EMT in ARPE-19 cells. A, cells were incubated in the absence or presence of TNF-α or TGF-β2 for 24 h. Some cells stimulated with TNF-α were treated with hyaluronidase (10 milliunits/ml) for 1 h before the addition of the fixed erythrocytes. Then the cells were incubated with fixed erythrocytes for 15 min, after which phase-contrast images were obtained (bottom panels). Individual cells were traced to determine the cell area (white dotted lines), and the external boundary of the halo was traced to determine the area of the pericellular matrix (yellow lines). The area between the two lines represents the area of the pericellular coat (particle-excluded area) and was expressed as the means ± S.D. for cells in 10 representative fields (upper panel). Scale bar, 20 μm. **, p < 0.01 (Student's t test). B, cells were cultured in the absence or presence of TNF-α, TGF-β2, or both cytokines for the indicated times, after which cell lysates were prepared and subjected to immunoblot analysis (IB) with antibodies to fibronectin, cytokeratin 18, or α-tubulin. C, confluent cells were cultured in the absence or presence of the HA synthesis inhibitor 4-MU (1 mm) for 24 h and then in the additional absence or presence of TNF-α for 4 days. The cells were then either examined by DIC microscopy or fixed and subjected to Giemsa staining. Scale bars, 100 μm (left panels) or 300 μm (right panels). D, cells exposed to 4-MU as in C were cultured in the additional absence or presence of TNF-α for 24 h. The cell monolayer was then scratched, and migration of cells into the wound area was observed at 0 and 30 h thereafter by DIC microscopy. Yellow lines indicate the initial margins of the wound. Scale bars, 100 μm. E, cells exposed to 4-MU as in C were cultured in the additional absence or presence of TNF-α for the indicated times, after which cell lysates were prepared and subjected to immunoblot analysis with antibodies to fibronectin, α-SMA, or α-tubulin. Numbers below each lane represent the intensity of each band normalized by that of α-tubulin and expressed relative to the normalized value for control cells.
FIGURE 3.
FIGURE 3.
TNF-α promotes HA-CD44 interaction in ARPE-19 cells. A, cells were cultured in the absence or presence of TNF-α or TGF-β2 for 24 h and then subjected to RT-PCR analysis of CD44 or β-actin mRNAs. B, cells were cultured in the presence of TNF-α for the indicated times, after which cell lysates were prepared and subjected to immunoblot analysis (IB) with antibodies to CD44 or to α-tubulin (loading control). C, cells were incubated in the absence or presence of TNF-α or TGF-β2 with or without the IM-7.8.1 antibody to CD44 (20 μg/ml) or control immunoglobulin G (IgG) for 24 h and then in the additional presence of fluorescein-HA for 6 h. The binding of fluorescein-HA to the cells was then determined by fluorescence microscopic analysis and expressed relative to the level observed with control cells. Data are the means ± S.D. of values from 12 different fields in each of three independent experiments. *, p < 0.05 (Student's t test). D, cells were cultured for 24 h in the absence or presence of TNF-α and with the IM-7.8.1 antibody to CD44 or control IgG. The cells were then incubated with fixed erythrocytes for 15 min, after which phase-contrast images were obtained (bottom panels). The area of the pericellular coat (particle-excluded area) was determined as in Fig. 2A. Data are the means ± S.D. for cells in 10 representative fields. Scale bar, 20 μm. **, p < 0.01 (Student's t test).
FIGURE 4.
FIGURE 4.
TNF-α induces phosphorylation of ERM and the interaction of ERM with CD44-HA in a PKC-dependent manner in ARPE-19 cells. A, cells were cultured in the absence or presence of TNF-α for 24 h, with the indicated inhibitors GF109203X (2.5 μm), Y-27632 (5 μm), SB203580 (20 μm) added to the medium for the final 3 h. Cell lysates were then prepared and subjected to immunoblot analysis (IB) with antibodies to pERM, ezrin, or moesin. The arrowhead and arrow indicate ezrin-radixin and moesin, respectively. B, cells were cultured in the absence or presence of TNF-α for 24 h and then subjected to fluorescence microscopic analysis with antibodies to CD44 and to pERM (upper panels) or with antibodies to CD44 and HA binding protein (lower panels). Arrows indicate colocalization of CD44 and pERM and of CD44 and HA in characteristic spherical extrusions at the cell periphery, respectively. Scale bars, 20 μm. It should be noted that HA was also detected in nucleus in both control and TNF-α-treated cells as previously reported (65). C, cells cultured in the absence or presence of TNF-α for 24 h were lysed and subjected to immunoprecipitation (IP) with antibody to CD44 or with control IgG. The resulting precipitates as well as the cell lysates (2% of the input for immunoprecipitation) were subjected to immunoblot analysis with antibodies to moesin or to CD44. D, cells were incubated in the absence or presence of TNF-α with or without GF109203X for 24 h and then in the additional presence of fluorescein-HA for 6 h. The binding of fluorescein-HA to the cells was then determined by fluorescence microscopic analysis and expressed relative to the level observed with control cells. Data are the means ± S.D. of values from 12 different fields in each of three independent experiments. *, p < 0.05 (Student's t test). E, cells were cultured for 24 h in the absence or presence of TNF-α with or without GF109203X, SB431542, or Y-27632. The cells were then incubated with fixed erythrocytes. Phase contrast images were obtained for determination of the area of the pericellular coat (particle-excluded area). Data are the means ± S.D. for cells in 10 representative fields. Scale bar, 20 μm. **, p < 0.01 (Student's t test).
FIGURE 5.
FIGURE 5.
Moesin plays an essential role in TNF-α-induced EMT in ARPE-19 cells. A, cells were cultured for 24 h in the absence or presence of TNF-α or GF109203X, as indicated, and were then subjected to fluorescence microscopic analysis with antibody to pERM and with phalloidin for detection of F-actin (left panels) or with antibody to CD44 and with phalloidin (right panels). Arrowheads indicate actin microdomain formation by TNF-α treatment. Scale bars, 20 μm. B, lysates of cells transfected with control or moesin siRNAs were subjected to immunoblot analysis (IB) with antibodies to ERM or to α-tubulin. The arrowhead and arrow correspond to ezrin-radixin and moesin, respectively. C, cells transfected with control or moesin siRNAs were incubated in the absence or presence of TNF-α for 24 h and then subjected to fluorescence microscopic analysis with antibodies to N-cadherin and moesin and with phalloidin to visualize F-actin. Arrowheads indicate actin microdomain formation by TNF-α treatment. Scale bars, 20 μm. D, cells treated as in C were subjected to the in vitro wound healing assay as in Fig. 2C (see supplemental Movies 3–5). Still images at 0, 24, and 48 h are shown. E, quantification of cell migration is shown in D. The distance between leading edges of three migrating cells and the wound edge was measured in time-lapse images at the indicated times. Data (% migration) are the means ± S.D. *, p < 0.05, **, p < 0.01 (Student's t test). F, cells treated as in D for 6 h were subjected to immunofluorescence staining with antibodies to N-cadherin and to moesin.
FIGURE 6.
FIGURE 6.
TNF-α-induced interaction of CD44 with TGF-β receptor II is essential for TGF-β-dependent EMT. A, cells cultured with or without TNF-α for 48 h were subjected to immunofluorescence staining with antibodies to TGF-β receptor II and to CD44. Yellow arrowheads indicate the colocalization of TGF-β receptor II (TGFBRII) and CD44 in ARPE-19 cells treated with TFN-α. Scale bars, 20 μm. B, cells cultured with or without TFN-α for 48 h and TGF-β2 for the last 15 min were lysed and subjected to immunoprecipitation (IP) with antibodies to TGF-β receptor II or to CD44 or with control IgG. The resulting precipitates as well as the whole cell lysates were subjected to immunoblot (IB) analysis with antibodies to TGF-β receptor II or to CD44. C, cells cultured with or without TNF-α for 48 h were stained with antibodies to clathrin and to CD44. Yellow arrowheads indicate the colocalization of clathrin and CD44 in ARPE-19 cells treated with TFN-α. Scale bars, 10 μm. D, cells cultured with or without TNF-α for 48 h were stained with antibodies to caveolin and to CD44. Caveolin did not colocalize to CD44. Scale bars, 20 μm. E, The ratio of clathrin-positive spots merged with CD44-positive spots was counted after the immunofluorescence staining of ARPE-19 cells treated with or without TNF-α. Data are means ± S.D. for cells in three representative fields. *p < 0.05 (Student's t test). F, lysates of cells transfected with control or CD44 siRNAs were subjected to immunoblot analysis with antibodies to CD44 or to α-tubulin. G, cells transfected with control or CD44 siRNAs were incubated in the absence or presence of TNF-α, TGF-β2, or SB431542 for 48 h, after which cell lysates were prepared and subjected to immunoblot analysis with antibodies to phosphorylated or total forms of Smad2, fibronectin, or α-tubulin. H, cells transfected with control or CD44 siRNAs were incubated in the absence or presence of both TNF-α and TGF-β2 for 48 h, fixed, and subjected to Giemsa staining for determination of the number of EAFDs. Data are the means ± S.D. for 12 different fields in each of three independent experiments. **, p < 0.01 (Student's t test). I, cells treated as in H were subjected to immunofluorescence staining with antibodies to CD44, HA binding protein, and 4′,6-diamidino-2-phenylindole (DAPI, for nuclei). Scale bars, 100 μm.
FIGURE 7.
FIGURE 7.
TNF-α-induced acquisition of the mesenchymal phenotype mediated by CD44 results in fibrosis in the mouse eye. A, shown is the experimental system for RPE culture. Pieces of the posterior eyecup with the retina removed were flattened (RPE layer down) by Matrigel onto a cell culture insert and then incubated with culture medium in the lower chamber containing (or not) TNF-α (10 ng/ml) or TGF-β2 (5 ng/ml). B, tissue incubated as in A with or without TNF-α or TGF-β2 for 3 days was fixed and subjected to immunofluorescence staining with antibody to N-cadherin. Scale bars, 20 μm. C, tissue from wild-type (WT) or CD44 knock-out (CD44−/−) mouse littermates was incubated as in A in the absence or presence of TNF-α for 7 days, fixed, and subjected to fluorescence microscopic analysis with HA binding protein and antibody to N-cadherin. Merged images show HA in green and N-cadherin in red. Scale bars, 20 μm. D, TNF-α or PBS was injected into the subretinal layer of CD44 knock-out (KO) or wild-type mouse littermates. Eyes were enucleated 14 days after injection, fixed, and embedded in paraffin. Sections were then prepared and stained with hematoxylin-eosin. Areas demarcated by yellow arrows indicate the RPE at the site of the injection (left panels). R, retina; C, choroid. Scale bars, 80 μm. Higher magnification images of the demarcated areas are shown in the right panels. E, sections of eyes treated as in D were subjected to immunofluorescence staining with antibodies to α-SMA, N-cadherin, and CD44. Scale bars, 50 μm. WT, wild type.
FIGURE 8.
FIGURE 8.
Model of the signaling pathways underlying TNF-α-induced EMT. TNF-α induces the expression of CD44 and the phosphorylation of ERM in a manner dependent on PKC activation and thereby promotes formation of the HA·CD44·pERM complex. This complex then triggers remodeling of the actin cytoskeleton and the CD44-TGF-β receptor interaction, leading to the activation of Smad signaling through TGF-β receptor clustering and EMT induction. Persistent activation of EMT results in fibrotic disorder.

Similar articles

Cited by

References

    1. Lee J. M., Dedhar S., Kalluri R., Thompson E. W. (2006) J. Cell Biol. 172, 973–981 - PMC - PubMed
    1. Thiery J. P. (2002) Nat. Rev. Cancer 2, 442–454 - PubMed
    1. Kalluri R., Neilson E. G. (2003) J. Clin. Invest. 112, 1776–1784 - PMC - PubMed
    1. Zuk A., Matlin K. S., Hay E. D. (1989) J. Cell Biol. 108, 903–919 - PMC - PubMed
    1. Shintani Y., Wheelock M. J., Johnson K. R. (2006) Mol. Biol. Cell 17, 2963–2975 - PMC - PubMed

Publication types

MeSH terms

Substances

Associated data