Optimization of minimum set of protein-DNA interactions: a quasi exact solution with minimum over-fitting
- PMID: 19965883
- PMCID: PMC2815656
- DOI: 10.1093/bioinformatics/btp664
Optimization of minimum set of protein-DNA interactions: a quasi exact solution with minimum over-fitting
Abstract
Motivation: A major limitation in modeling protein interactions is the difficulty of assessing the over-fitting of the training set. Recently, an experimentally based approach that integrates crystallographic information of C2H2 zinc finger-DNA complexes with binding data from 11 mutants, 7 from EGR finger I, was used to define an improved interaction code (no optimization). Here, we present a novel mixed integer programming (MIP)-based method that transforms this type of data into an optimized code, demonstrating both the advantages of the mathematical formulation to minimize over- and under-fitting and the robustness of the underlying physical parameters mapped by the code.
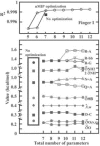
Results: Based on the structural models of feasible interaction networks for 35 mutants of EGR-DNA complexes, the MIP method minimizes the cumulative binding energy over all complexes for a general set of fundamental protein-DNA interactions. To guard against over-fitting, we use the scalability of the method to probe against the elimination of related interactions. From an initial set of 12 parameters (six hydrogen bonds, five desolvation penalties and a water factor), we proceed to eliminate five of them with only a marginal reduction of the correlation coefficient to 0.9983. Further reduction of parameters negatively impacts the performance of the code (under-fitting). Besides accurately predicting the change in binding affinity of validation sets, the code identifies possible context-dependent effects in the definition of the interaction networks. Yet, the approach of constraining predictions to within a pre-selected set of interactions limits the impact of these potential errors to related low-affinity complexes.
Supplementary information: Supplementary data are available at Bioinformatics online.
Figures


Similar articles
-
Context-dependent DNA recognition code for C2H2 zinc-finger transcription factors.Bioinformatics. 2008 Sep 1;24(17):1850-7. doi: 10.1093/bioinformatics/btn331. Epub 2008 Jun 27. Bioinformatics. 2008. PMID: 18586699 Free PMC article.
-
Probabilistic code for DNA recognition by proteins of the EGR family.J Mol Biol. 2002 Nov 1;323(4):701-27. doi: 10.1016/s0022-2836(02)00917-8. J Mol Biol. 2002. PMID: 12419259
-
Experimentally based contact energies decode interactions responsible for protein-DNA affinity and the role of molecular waters at the binding interface.Nucleic Acids Res. 2009 Jul;37(12):4076-88. doi: 10.1093/nar/gkp289. Epub 2009 May 8. Nucleic Acids Res. 2009. PMID: 19429892 Free PMC article.
-
Computational approaches for predicting the binding sites and understanding the recognition mechanism of protein-DNA complexes.Adv Protein Chem Struct Biol. 2013;91:65-99. doi: 10.1016/B978-0-12-411637-5.00003-2. Adv Protein Chem Struct Biol. 2013. PMID: 23790211 Review.
-
DNA recognition of C2H2 zinc-finger proteins. Evidence for a zinc-finger-specific DNA recognition code.Ann N Y Acad Sci. 1993 Jun 11;684:246-9. doi: 10.1111/j.1749-6632.1993.tb32299.x. Ann N Y Acad Sci. 1993. PMID: 8317844 Review. No abstract available.
Cited by
-
Multi-task bioassay pre-training for protein-ligand binding affinity prediction.Brief Bioinform. 2023 Nov 22;25(1):bbad451. doi: 10.1093/bib/bbad451. Brief Bioinform. 2023. PMID: 38084920 Free PMC article.
-
Optimal affinity ranking for automated virtual screening validated in prospective D3R grand challenges.J Comput Aided Mol Des. 2018 Jan;32(1):287-297. doi: 10.1007/s10822-017-0065-y. Epub 2017 Sep 16. J Comput Aided Mol Des. 2018. PMID: 28918599 Free PMC article.
-
Challenges, applications, and recent advances of protein-ligand docking in structure-based drug design.Molecules. 2014 Jul 11;19(7):10150-76. doi: 10.3390/molecules190710150. Molecules. 2014. PMID: 25019558 Free PMC article. Review.
References
-
- Bae KH, et al. Human zinc fingers as building blocks in the construction of artificial transcription factors. Nat. Biotechnol. 2003;21:275–280. - PubMed
-
- Bonvin AM, et al. Water molecules in DNA recognition II: a molecular dynamics view of the structure and hydration of the trp operator. J. Mol. Biol. 1998;282:859–873. - PubMed
-
- Bueno M, Camacho CJ. Acidic groups docked to well defined wetted pockets at the core of the binding interface: a tale of scoring and missing protein interactions in CAPRI. Proteins. 2007a;69:786–792. - PubMed
-
- Bueno M, et al. SIMPLE estimate of the free energy change due to aliphatic mutations: superior predictions based on first principles. Proteins. 2007b;68:850–862. - PubMed
-
- Camacho CJ, et al. Scoring a diverse set of high-quality docked conformations: a metascore based on electrostatic and desolvation interactions. Proteins. 2006;63:868–877. - PubMed

