

Making scents: dynamic olfactometry for threshold measurement
- PMID: 19965900
- PMCID: PMC2805809
- DOI: 10.1093/chemse/bjp088
Making scents: dynamic olfactometry for threshold measurement
Abstract
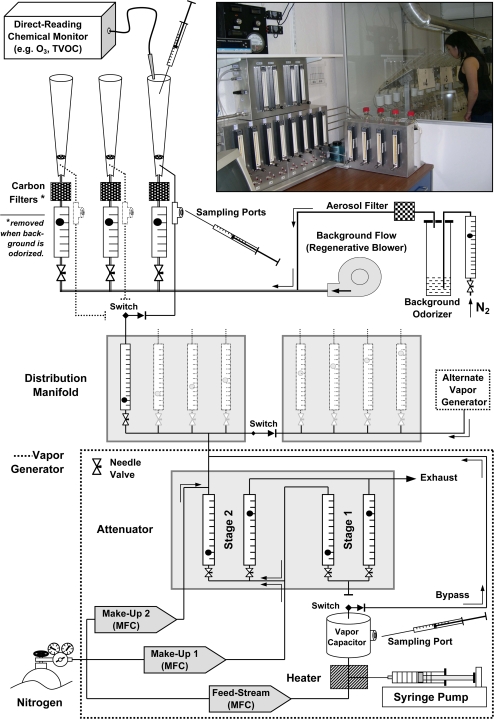
Data on human odor thresholds show disparities huge enough to marginalize olfactory psychophysics and delegitimize importation of its data into other areas. Variation of orders of magnitude from study to study, much of it systematic, threatens meaningful comparisons with animal species, comparison between in vivo with in vitro studies, the search for molecular determinants of potency, and use of olfactory information for environmental or public health policy. On the premise that good experimental results will flow from use of good tools, this report describes a vapor delivery system and its peripherals that instantiate good tools. The vapor delivery device 8 (VDD8) provides flexibility in range of delivered concentrations, offers definable stability of delivery, accommodates solvent-free delivery below a part per trillion, gives a realistic interface with subjects, has accessible and replaceable components, and adapts to a variety of psychophysical methodologies. The device serves most often for measurement of absolute sensitivity, where its design encourages collection of thousands of judgments per day from subjects tested simultaneously. The results have shown humans to be more sensitive and less variable than has previous testing. The VDD8 can also serve for measurement of differential sensitivity, discrimination of quality, and perception of mixtures and masking. The exposition seeks to transmit general lessons while it proffers some specifics of design to reproduce features of the device in a new or existing system. The principles can apply to devices for animal testing.
Figures
Similar articles
-
The perception of odor is not a surrogate marker for chemical exposure: a review of factors influencing human odor perception.Clin Toxicol (Phila). 2013 Feb;51(2):70-6. doi: 10.3109/15563650.2013.767908. Clin Toxicol (Phila). 2013. PMID: 23387344 Review.
-
SMELL-S and SMELL-R: Olfactory tests not influenced by odor-specific insensitivity or prior olfactory experience.Proc Natl Acad Sci U S A. 2017 Oct 24;114(43):11275-11284. doi: 10.1073/pnas.1711415114. Epub 2017 Oct 10. Proc Natl Acad Sci U S A. 2017. PMID: 29073044 Free PMC article.
-
Olfactory and nonolfactory odor detection in pigeons: elucidation by a cardiac acceleration paradigm.Physiol Behav. 1986 Oct;38(4):575-80. doi: 10.1016/0031-9384(86)90428-2. Physiol Behav. 1986. PMID: 3823172
-
Characterization of Key Aroma Compounds in a Commercial Rum and an Australian Red Wine by Means of a New Sensomics-Based Expert System (SEBES)-An Approach To Use Artificial Intelligence in Determining Food Odor Codes.J Agric Food Chem. 2019 Apr 10;67(14):4011-4022. doi: 10.1021/acs.jafc.9b00708. Epub 2019 Mar 26. J Agric Food Chem. 2019. PMID: 30879302
-
Mixture processing and odor-object segregation in insects.Prog Brain Res. 2014;208:63-85. doi: 10.1016/B978-0-444-63350-7.00003-6. Prog Brain Res. 2014. PMID: 24767479 Review.
Cited by
-
Canine Olfactory Thresholds to Amyl Acetate in a Biomedical Detection Scenario.Front Vet Sci. 2019 Jan 22;5:345. doi: 10.3389/fvets.2018.00345. eCollection 2018. Front Vet Sci. 2019. PMID: 30723722 Free PMC article.
-
VOCs and Odor Episodes near the German-Czech Border: Social Participation, Chemical Analyses and Health Risk Assessment.Int J Environ Res Public Health. 2022 Jan 24;19(3):1296. doi: 10.3390/ijerph19031296. Int J Environ Res Public Health. 2022. PMID: 35162316 Free PMC article.
-
Bewertung von Geruchsstoffen in der Innenraumluft – Weiterentwicklung des Geruchsleitwerte-Konzeptes des AIR : Mitteilung des Ausschusses für Innenraumrichtwerte.Bundesgesundheitsblatt Gesundheitsforschung Gesundheitsschutz. 2023 Apr;66(4):452-459. doi: 10.1007/s00103-023-03682-8. Bundesgesundheitsblatt Gesundheitsforschung Gesundheitsschutz. 2023. PMID: 36995393 German. No abstract available.
-
A quantitative framework for predicting odor intensity across molecule and mixtures.bioRxiv [Preprint]. 2025 Aug 12:2025.08.08.668954. doi: 10.1101/2025.08.08.668954. bioRxiv. 2025. PMID: 40832259 Free PMC article. Preprint.
-
Influence of Malted Chickpea on the Composition of Volatiles in Hummus.Molecules. 2025 Mar 10;30(6):1231. doi: 10.3390/molecules30061231. Molecules. 2025. PMID: 40142007 Free PMC article.
References
-
- American Industrial Hygiene Association. Odor thresholds for chemicals with established occupational health standards. Akron (OH): AIHA; 1989.
-
- American Society for Testing and Materials. ASTM E544-99(2004) standard practices for referencing suprathreshold odor intensity. Philadelphia (PA): ASTM; 2004.
-
- Ballantyne B, Jordan SL. Toxicological, medical and industrial hygiene aspects of glutaraldehyde with particular reference to its biocidal use in cold sterilization procedures. J Appl Toxicol. 2001;21(2):131–151. - PubMed
-
- Cain WS. Olfaction. In: Atkinson RC, Herrnstein RJ, Lindzey G, Luce RD, editors. Stevens’ handbook of experimental psychology, Vol. I: perception and motivation, rev. ed. New York: Wiley; l988. pp. 409–459.
-
- Cain WS, Schmidt R. Can we trust odor databases? Example of t- and n-butyl acetate. Atmos Environ. 2009;43:2591–2601.
Publication types
MeSH terms
Substances
Grants and funding
LinkOut - more resources
Full Text Sources
Other Literature Sources
Molecular Biology Databases
