

Serum- and glucocorticoid-inducible kinase 1 (SGK1) regulates adipocyte differentiation via forkhead box O1
- PMID: 19965929
- PMCID: PMC2817604
- DOI: 10.1210/me.2009-0265
Serum- and glucocorticoid-inducible kinase 1 (SGK1) regulates adipocyte differentiation via forkhead box O1
Abstract
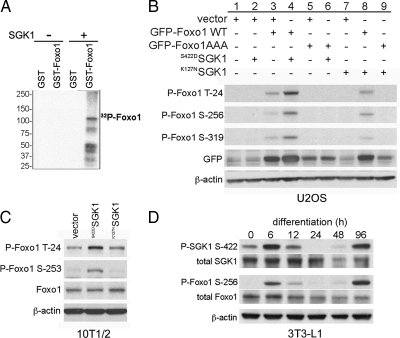
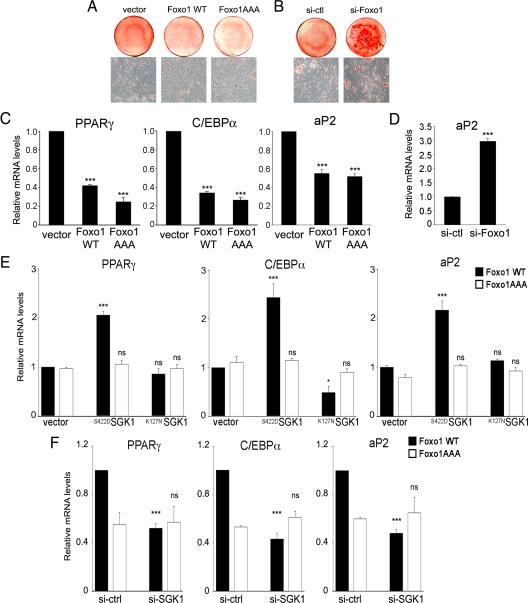
The serum and glucocorticoid-inducible kinase 1 (SGK1) is an inducible kinase the physiological function of which has been characterized primarily in the kidney. Here we show that SGK1 is expressed in white adipose tissue and that its levels are induced in the conversion of preadipocytes into fat cells. Adipocyte differentiation is significantly diminished via small interfering RNA inhibition of endogenous SGK1 expression, whereas ectopic expression of SGK1 in mesenchymal precursor cells promotes adipogenesis. The SGK1-mediated phenotypic effects on differentiation parallel changes in the mRNA levels for critical regulators and markers of adipogenesis, such as peroxisome proliferator-activated receptor gamma, CCAAT enhancer binding protein alpha, and fatty acid binding protein aP2. We demonstrate that SGK1 affects differentiation by direct phosphorylation of Foxo1, thereby changing its cellular localization from the nucleus to the cytosol. In addition we show that SGK1-/- cells are unable to relocalize Foxo1 to the cytosol in response to dexamethasone. Together these results show that SGK1 influences adipocyte differentiation by regulating Foxo1 phosphorylation and reveal a potentially important function for this kinase in the control of fat mass and function.
Figures


Similar articles
-
Ndrg1 promotes adipocyte differentiation and sustains their function.Sci Rep. 2017 Aug 3;7(1):7191. doi: 10.1038/s41598-017-07497-x. Sci Rep. 2017. PMID: 28775290 Free PMC article.
-
Akt3 inhibits adipogenesis and protects from diet-induced obesity via WNK1/SGK1 signaling.JCI Insight. 2017 Nov 16;2(22):e95687. doi: 10.1172/jci.insight.95687. eCollection 2017 Nov 16. JCI Insight. 2017. PMID: 29202451 Free PMC article.
-
SGK1 promotes the lipid accumulation via regulating the transcriptional activity of FOXO1 in bovine.BMC Genomics. 2024 Jul 30;25(1):737. doi: 10.1186/s12864-024-10644-0. BMC Genomics. 2024. PMID: 39080526 Free PMC article.
-
Significance of SGK1 in the regulation of neuronal function.J Physiol. 2010 Sep 15;588(Pt 18):3349-54. doi: 10.1113/jphysiol.2010.190926. Epub 2010 Jun 7. J Physiol. 2010. PMID: 20530112 Free PMC article. Review.
-
Therapeutic potential of serum and glucocorticoid inducible kinase inhibition.Expert Opin Investig Drugs. 2013 Jun;22(6):701-14. doi: 10.1517/13543784.2013.778971. Epub 2013 Mar 19. Expert Opin Investig Drugs. 2013. PMID: 23506284 Review.
Cited by
-
Serine/threonine protein kinase SGK1 in glucocorticoid-dependent transdifferentiation of pancreatic acinar cells to hepatocytes.J Cell Sci. 2011 Feb 1;124(Pt 3):405-13. doi: 10.1242/jcs.077503. Epub 2011 Jan 11. J Cell Sci. 2011. PMID: 21224398 Free PMC article.
-
Decidualization score identifies an endometrial dysregulation in samples from women with recurrent pregnancy losses and unexplained infertility.F S Rep. 2020 Dec 29;2(1):95-103. doi: 10.1016/j.xfre.2020.12.004. eCollection 2021 Mar. F S Rep. 2020. PMID: 34223279 Free PMC article.
-
Ndrg1 promotes adipocyte differentiation and sustains their function.Sci Rep. 2017 Aug 3;7(1):7191. doi: 10.1038/s41598-017-07497-x. Sci Rep. 2017. PMID: 28775290 Free PMC article.
-
FoxO1, A2M, and TGF-β1: three novel genes predicting depression in gene X environment interactions are identified using cross-species and cross-tissues transcriptomic and miRNomic analyses.Mol Psychiatry. 2018 Nov;23(11):2192-2208. doi: 10.1038/s41380-017-0002-4. Epub 2018 Jan 4. Mol Psychiatry. 2018. PMID: 29302075 Free PMC article.
-
SGK1: The Dark Side of PI3K Signaling.Curr Top Dev Biol. 2017;123:49-71. doi: 10.1016/bs.ctdb.2016.11.006. Epub 2016 Dec 15. Curr Top Dev Biol. 2017. PMID: 28236975 Free PMC article. Review.
References
-
- Spiegelman BM, Flier JS 2001 Obesity and the regulation of energy balance. Cell 104:531–543 - PubMed
-
- Eriksson JW, Smith U, Waagstein F, Wysocki M, Jansson PA 1999 Glucose turnover and adipose tissue lipolysis are insulin-resistant in healthy relatives of type 2 diabetes patients: is cellular insulin resistance a secondary phenomenon? Diabetes 48:1572–1578 - PubMed
-
- Vega GL 2004 Obesity and the metabolic syndrome. Minerva Endocrinol 29:47–54 - PubMed
-
- Tontonoz P, Hu E, Graves RA, Budavari AI, Spiegelman BM 1994 mPPAR γ 2: tissue-specific regulator of an adipocyte enhancer. Genes Dev 8:1224–1234 - PubMed
Publication types
MeSH terms
Substances
Grants and funding
LinkOut - more resources
Full Text Sources
Medical
Molecular Biology Databases
Research Materials
Miscellaneous
