. 2010 Feb;152(2):787-96.
doi: 10.1104/pp.109.150128. Epub 2009 Dec 4.

Real-time imaging of cellulose reorientation during cell wall expansion in Arabidopsis roots

Affiliations

Real-time imaging of cellulose reorientation during cell wall expansion in Arabidopsis roots

Charles T Anderson et al. Plant Physiol. 2010 Feb.

Abstract

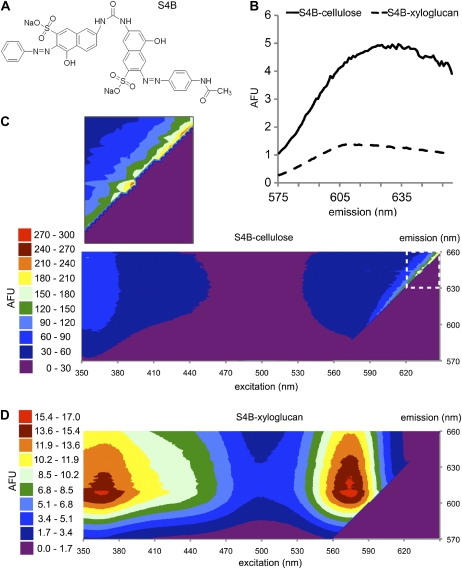
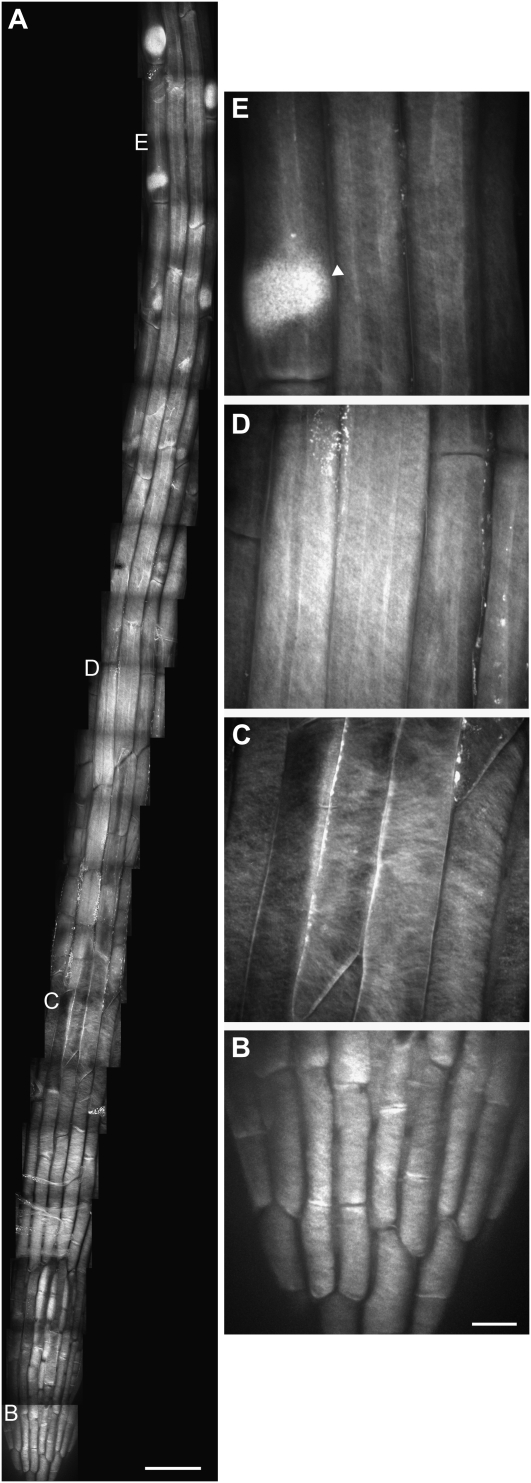
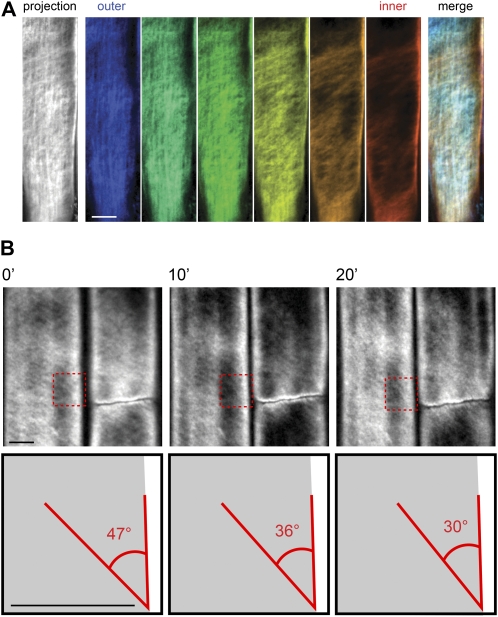
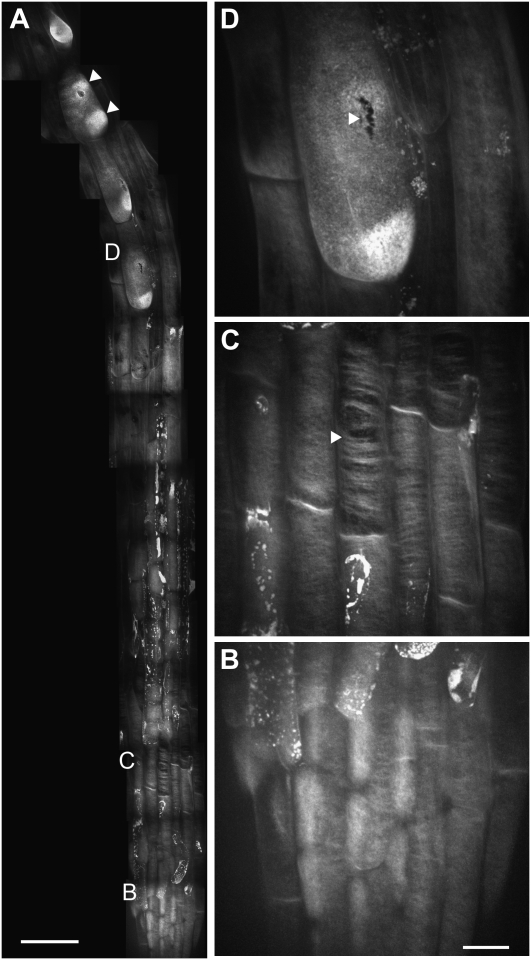
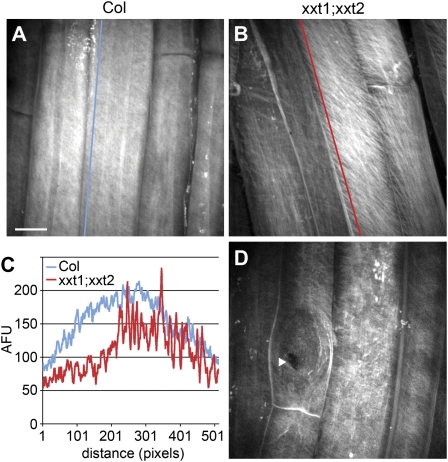
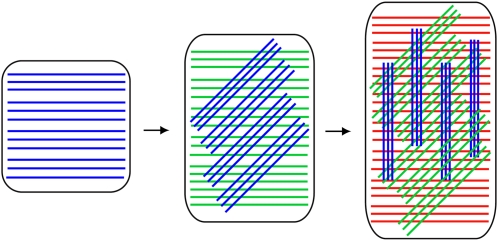
Cellulose forms the major load-bearing network of the plant cell wall, which simultaneously protects the cell and directs its growth. Although the process of cellulose synthesis has been observed, little is known about the behavior of cellulose in the wall after synthesis. Using Pontamine Fast Scarlet 4B, a dye that fluoresces preferentially in the presence of cellulose and has excitation and emission wavelengths suitable for confocal microscopy, we imaged the architecture and dynamics of cellulose in the cell walls of expanding root cells. We found that cellulose exists in Arabidopsis (Arabidopsis thaliana) cell walls in large fibrillar bundles that vary in orientation. During anisotropic wall expansion in wild-type plants, we observed that these cellulose bundles rotate in a transverse to longitudinal direction. We also found that cellulose organization is significantly altered in mutants lacking either a cellulose synthase subunit or two xyloglucan xylosyltransferase isoforms. Our results support a model in which cellulose is deposited transversely to accommodate longitudinal cell expansion and reoriented during expansion to generate a cell wall that is fortified against strain from any direction.


Figures

Figure 1.
Figure 1.
S4B becomes highly fluorescent upon cellulose binding. A, Structure of S4B. B, Profiles of emission intensities for S4B after excitation at 561 nm in solutions containing equal masses of xyloglucan (dotted line) or cellulose (solid line). AFU, Arbitrary fluorescence units. C, Contour plot of fluorescence recorded across a range of excitation and emission wavelengths for S4B in a cellulose mixture. Enlarged area (dashed box) shows sharp fluorescence peak in visible wavelengths. D, Similar contour plot for S4B in a xyloglucan solution. Note the difference in scales for plots in C and D.
Figure 2.
Figure 2.
S4B staining pattern in Arabidopsis root cells. A, Mosaic of micrographs of the division, elongation, and early differentiation zones in a 5-d-old light-grown Col seedling stained with S4B. Smaller letters correspond to enlargements in B to E. B, Enlargement of root tip showing finely spaced fibrillar staining. C, Enlargement of lateral root cap showing widely spaced diagonal fibrillar staining. D, Enlargement of elongation zone showing finely spaced longitudinal and diagonal fibrillar staining. E, Enlargement of differentiation zone showing bright staining of root hair primordium in trichoblast (arrowhead). All images are maximum projections of z series. Scale bars are 50 μm (A) or 10 μm (for B–E).
Figure 3.
Figure 3.
S4B staining allows imaging of cellulose architecture and dynamics. A, Imaging of cellulose orientation in different cell wall layers using S4B staining. Left section, maximum projection of z series through the cell wall in a 7-d-old light-grown Col seedling stained with S4B. Middle sections, pseudocolor-coded slices from the same z series progressing from the outer surface (blue) to the inner surface (red) of the cell wall, with the fibrillar staining pattern transitioning from longitudinal to transverse/diagonal. Spacing between z slices is 200 nm. Right section, merge of pseudocolor-coded slices showing different orientations of fibrillar staining in the outer and inner wall layers. B, Rotation over time of fibrillar staining in elongation zone epidermal cells stained with S4B. Top sections, time points (0′, 10′, 20′) from a time-lapse recording (see Supplemental Movie S1) of an elongating root epidermal cell in a 5-d-old light-grown Col seedling stained with S4B. Bottom sections, cartoon representation of boxes in top sections. The angle between a fibrillar structure and the long axis of the cell decreases from 47° to 30° over 20′. Note that a cell with extraordinarily rapid fiber rotation was chosen for illustrative purposes. Scale bars are 5 μm.
Figure 4.
Figure 4.
S4B staining pattern in prc1-1 root cells. A, Mosaic of micrographs from a 5-d-old light-grown prc1-1 seedling stained with S4B. Arrowheads show multiple bright patches in a single trichoblast. Irregular bright staining along root likely represents dead cells that have absorbed S4B. B, Enlargement of root tip cells showing fibrillar staining. C, Enlargement of lateral root cap cells showing large gaps in thick, curved fibrillar staining (e.g. arrowhead). D, Enlargement of differentiation zone cell showing rupture in trichoblast cell wall (arrowhead). All images are maximum projections of z series. Scale bars are 50 μm (A) or 10 μm (for B–D).
Figure 5.
Figure 5.
S4B staining pattern in xxt1;xxt2 root cells. A, Col root elongation zone cells stained with S4B. B, xxt1;xxt2 elongation zone cells showing striated fibrillar staining. C, Plot of fluorescence intensity along lines in A and B showing relatively even S4B staining profile in Col and uneven profile in xxt1;xxt2. AFU, Arbitrary fluorescence units. D, Differentiation zone cells showing rupture in trichoblast cell wall (arrowhead); note lack of bright staining at root hair primordium (bulged region around arrowhead). All images are maximum projections of z series. Scale bar in A applies to B and D and is 10 μm.
Figure 6.
Figure 6.
Effects of S4B and 7GFE on root growth. Seedlings were sown on plates with the indicated amounts (w/v) of S4B (A and C) or 7GFE (B and D). Primary root length was measured at day 11 in A and B. Asterisks indicate a significant difference from control (P < 0.001) in a two-tailed t test. MS, Murashige and Skoog medium.
Figure 7.
Figure 7.
Model for cellulose microfibril dynamics during cell wall expansion. In a longitudinally expanding cell, newly synthesized cellulose microfibrils at the inner wall face (blue) contain small initial spatial inhomogeneities that are amplified as cell expansion occurs and the fibers rotate from transverse to longitudinal. The synthesis and rotation of subsequent cellulose microfibrils (green, red) beneath the initial cellulose microfibril layer result in a cell wall with cellulose microfibrils oriented at multiple angles. Note that cellulose microfibrils are not necessarily synthesized in discrete layers, and cellulose microfibril rotation does not necessarily occur immediately after synthesis.

References

    1. Baskin TI (2005) Anisotropic expansion of the plant cell wall. Annu Rev Cell Dev Biol 21 203–222 - PubMed
    1. Baskin TI, Meekes HT, Liang BM, Sharp RE (1999) Regulation of growth anisotropy in well-watered and water-stressed maize roots. II. Role of cortical microtubules and cellulose microfibrils. Plant Physiol 119 681–692 - PMC - PubMed
    1. Beemster GT, Baskin TI (1998) Analysis of cell division and elongation underlying the developmental acceleration of root growth in Arabidopsis thaliana. Plant Physiol 116 1515–1526 - PMC - PubMed
    1. Boraston AB, Bolam DN, Gilbert HJ, Davies GJ (2004) Carbohydrate-binding modules: fine-tuning polysaccharide recognition. Biochem J 382 769–781 - PMC - PubMed
    1. Bruck H, Evans J, Peterson M (2002) The role of mechanics in biological and biologically inspired materials. Exp Mech 42 361–371

Publication types

MeSH terms