. 2010 Feb;152(2):1030-43.
doi: 10.1104/pp.109.143776. Epub 2009 Dec 4.

Tracing cationic nutrients from xylem into stem tissue of French bean by stable isotope tracers and cryo-secondary ion mass spectrometry

Affiliations

Tracing cationic nutrients from xylem into stem tissue of French bean by stable isotope tracers and cryo-secondary ion mass spectrometry

Ralf Metzner et al. Plant Physiol. 2010 Feb.

Abstract

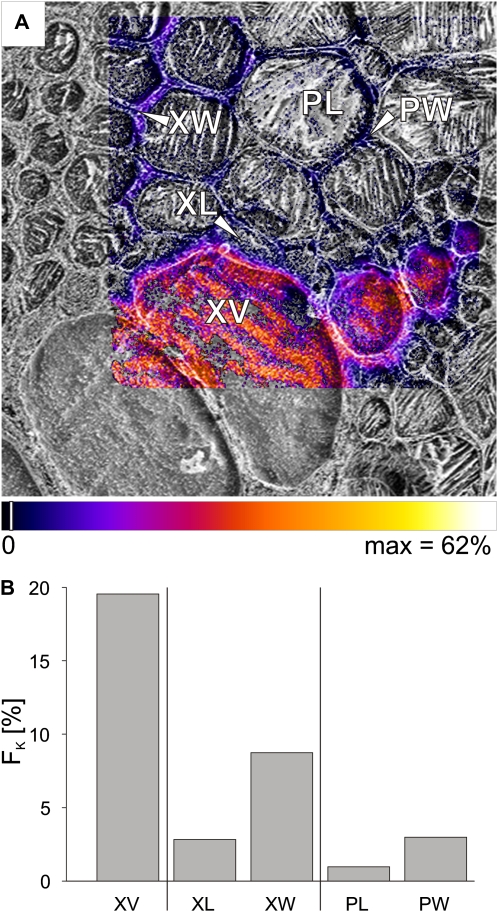
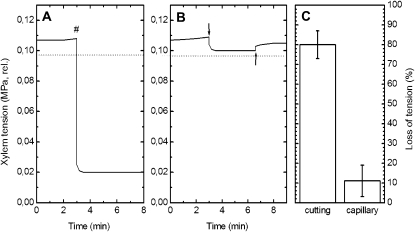
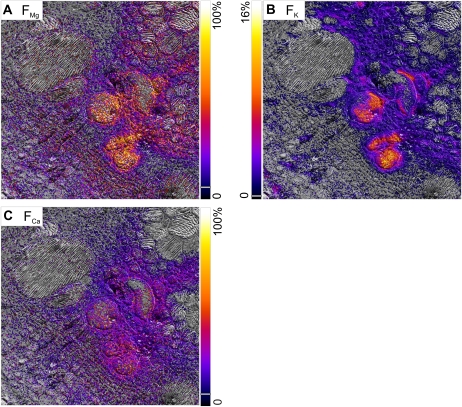
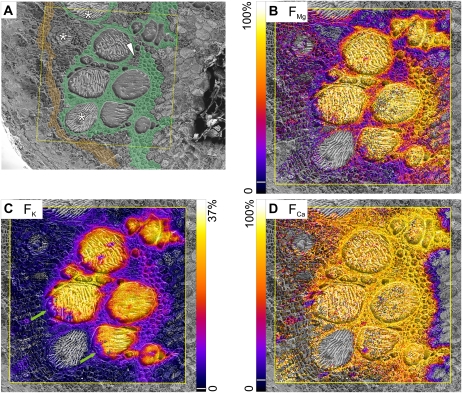
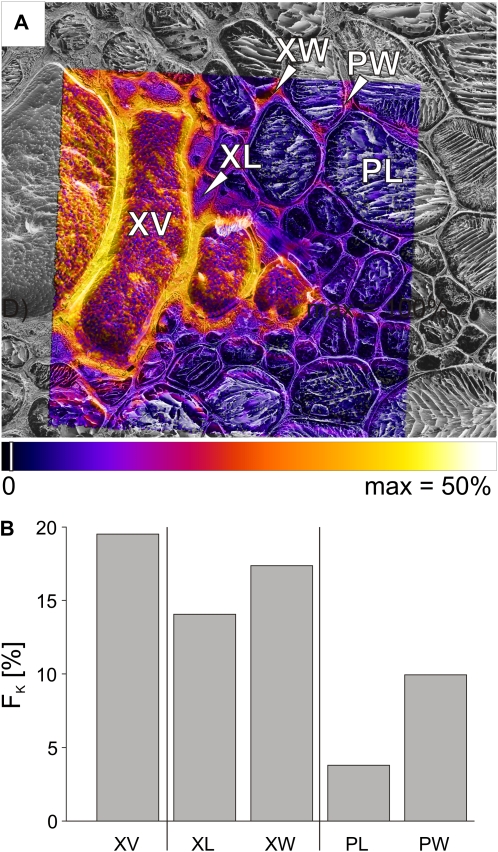
Fluxes of mineral nutrients in the xylem are strongly influenced by interactions with the surrounding stem tissues and are probably regulated by them. Toward a mechanistic understanding of these interactions, we applied stable isotope tracers of magnesium, potassium, and calcium continuously to the transpiration stream of cut bean (Phaseolus vulgaris) shoots to study their radial exchange at the cell and tissue level with stem tissues between pith and phloem. For isotope localization, we combined sample preparation with secondary ion mass spectrometry in a completely cryogenic workflow. After 20 min of application, tracers were readily detectable to various degrees in all tissues. The xylem parenchyma near the vessels exchanged freely with the vessels, its nutrient elements reaching a steady state of strong exchange with elements in the vessels within 20 min, mainly via apoplastic pathways. A slow exchange between vessels and cambium and phloem suggested that they are separated from the xylem, parenchyma, and pith, possibly by an apoplastic barrier to diffusion for nutrients (as for carbohydrates). There was little difference in these distributions when tracers were applied directly to intact xylem via a microcapillary, suggesting that xylem tension had little effect on radial exchange of these nutrients and that their movement was mainly diffusive.


Figures

Figure 1.
Figure 1.
Cross-sectional anatomy of the French bean stem. A, Tissue structures revealed in cryo-SEM by freeze etching the surface after the sample has been analyzed by cryo-SIMS. Xylem vessels (XV1–XV4) and two types of xylem parenchyma are visible that differ by their cell wall morphology. Thick-walled xylem parenchyma is composed of two subtypes, the small and weakly vacuolated cells enclosing the vessels in the shape of an axial sheath (subdivided for measurement purposes into half sheaths facing pith and cambium: XP-pi and XP-cm) and the larger and strongly vacuolated cells between the vessels (XP-xv). Thin-walled xylem parenchyma (XP-th) occurs between the cambium and the thick-walled xylem parenchyma. There are also islands of thin-walled xylem parenchyma (XP-is; arrowhead) within the thick-walled xylem parenchyma. Xylem is bordered toward the hollow center of the stem by the pith (Pi). Toward the stem periphery are the cambium (Cm) and phloem (Ph). On the top left is tissue and water that had not been cryo-planed. B, Light microscopic image of a hand section of a comparable tissue area. Double staining was with astra-blue (cellulose cell walls stain blue) and safranin (lignified cell walls stain red).
Figure 2.
Figure 2.
Cryo-SIMS mapping of signals of major isotopes of magnesium, potassium, and calcium. The images show the major natural isotope (left) and the major tracer isotope (right) in a sample taken after 20 min of continuous tracer application via the cut stem. The isotope images are laid over the corresponding cryo-SEM images (Fig. 1A). The yellow frame indicates area analyzed by cryo-SIMS. Scaling is linear from zero signal (S in counts per pixel) to individual maxima indicated in each image. In A and E, these were selected to optimize the display of detail in most parts of the images, at the expense of occasional oversaturation resulting in featureless white areas in the 24Mg and 40Ca images. Original maximum signal was for 96 (A) and 434 (E). For better visualization, pixels were set transparent where fractions fell below a threshold of the scale: 6% for A, B, E, and F and 3% for C and D. A small area in the top left corner of the images is blackened out and excluded from interpretation where the surface had not been properly cryo-planed. Area scanned by cryo-SIMS was 500 × 500 μm, 256 × 256 pixels.
Figure 3.
Figure 3.
Mapping of fractions of magnesium, potassium, and calcium, originating from the tracer solution, from samples taken after 20 min of continuous tracer application via the cut stem. A, Cryo-SEM image with color-coded overlay to help in the identification of tissue types: thick-walled xylem parenchyma (green) and cambium (orange). The asterisk indicates an immature vessel, and the white arrowhead indicates an island of thin-walled xylem parenchyma within thick-walled parenchyma. B to D, Fractions of tracer (FMg, FK, FCa) computed from cryo-SIMS isotope mapping are scaled from zero to the indicated maxima. For better visualization, pixels below the following threshold of the scale (indicated by white lines in the color bars) were set transparent: FMg and FCa, 6%; FK, 2%. Area scanned by cryo-SIMS was 500 × 500 μm2, 256 × 256 pixels. Images were overlaid on the corresponding cryo-SEM images. Green arrows indicate lower FK values along the outer rim of two xylem vessels.
Figure 4.
Figure 4.
Fractions of tracer in various types of stem tissue. A, Scheme of the ROI, specified according to anatomical criteria defined in Figure 1. B to D, Fractions of magnesium, potassium, and calcium, originating from the tracer solution, for each ROI, from three different experiments (error bars indicating 1 sd). Black columns, 20-min cut-stem application, transpiration rate 0.2 mL min−1. Fractions of potassium in the phloem and cambium were below the detection limit. White columns, transpiration rate 0.1 mL min−1. Cross-hatched columns, microcapillary, 20-min application, transpiration rate 0.1 mL min−1. Hatched columns, 240-min cut-stem application, transpiration rate 0.05 mL min−1.
Figure 5.
Figure 5.
Mapping of fractions FK of potassium, originating from the tracer solution, imaged at high spatial resolution after 20 min of tracer application via the cut stem. A, Potassium tracer fraction (FK) imaged for a bundle of metaxylem vessels as overlaid on the corresponding cryo-SEM image. The area was also imaged at low spatial resolution, as shown on the right side in Figure 3C. B, Bar chart of FK representing ROI for the xylem vessel (XV), the lumina (XL), and walls (XW) of small thick-walled xylem parenchyma cells bordering the vessel, as indicated in A. FK was also calculated separately for the lumina (PL) and walls (PW) of the pith, as visible toward the top right in A. Area scanned by cryo-SIMS was 121 × 121 μm, 256 × 256 pixels. Pixels were set transparent for fractions below a threshold of 2% of the scale (indicated by white lines in the color bar). The striped appearance of the xylem vessel lumina is probably due to the growth of ice crystals (Metzner et al., 2008).
Figure 6.
Figure 6.
Xylem tension (relative to the atmosphere) monitored by the xylem pressure probe during experiments parallel to tracer applications. A, Application via the cut stem. The number sign (#) indicates cutting of the stem under water. B, Application via a microcapillary. The downward arrow indicates insertion of the application microcapillary, and the upward arrow indicates withdrawal of this microcapillary. The horizontal dashed lines in A and B mark the saturation water vapor pressure (0.0977 MPa). C, Percentage loss in tension via the cut stem (n = 6; mean ± sd) and with capillary application (n = 4).
Figure 7.
Figure 7.
Microcapillary application. Mapping of fractions of magnesium, potassium, and calcium, originating from the tracer solution, for samples taken after continuous tracer application for 20 min. The images are overlaid onto the corresponding cryo-SEM images. Area scanned by cryo-SIMS was 500 × 500 μm, 256 × 256 pixels. For better visualization, pixels below the following thresholds of the scale (indicated by white lines in the color bars) were set transparent: FMg and FCa, 6%; FK, 2%.
Figure 8.
Figure 8.
Mapping of fractions of magnesium, potassium, and calcium, originating from the tracer solution, in samples taken after 240 min of continuous tracer application via the cut stem. A, Cryo-SEM image with color-coded overlay to show tissue types: thick-walled xylem parenchyma (green) and cambium (orange). Asterisks indicate immature vessels, and the white arrowhead indicates thin-walled xylem parenchyma within thick-walled parenchyma. B to D, Fractions of tracer (FMg, FK, FCa) are scaled from zero to the indicated maxima. For better visualization, pixels below the following thresholds of the scale (indicated by white lines in the color bars) were set transparent: FMg and FCa, 6%; FK, 2%. Area scanned by cryo-SIMS was 500 × 500 μm2, 256 × 256 pixels.
Figure 9.
Figure 9.
Mapping of the fraction of potassium, originating from the tracer solution, imaged at high spatial lateral resolution after 240 min of continuous tracer application. A, Potassium tracer fraction (FK) overlaid on the corresponding cryo-SEM image imaged for a bundle of metaxylem vessels (same as in top right corner in Fig. 8C). B, Bar chart of FK for the xylem vessel (XV), the lumina (XL), and walls (XW) of small thick-walled xylem parenchyma cells bordering the vessel as indicated in A. FK was also calculated separately for the lumina (PL) and walls (PW) of the pith, as visible toward the top right in A. Area scanned by cryo-SIMS was 115 × 115 μm2, 256 × 256 pixels. Pixels were set transparent for fractions below a threshold of 2% of the scale (indicated by the white line in the color bar).

Similar articles

Cited by

References

    1. Benkert R, Balling A, Zimmermann U (1991) Direct measurement of the pressure and flow in the xylem vessels of Nicotiana tabacum and their dependence on flow resistance and transpiration rate. Bot Acta 104 423–432
    1. Biddulph O, Markle J (1944) Translocation of radiophosphorus in the phloem of the cotton plant. Am J Bot 31 65–70
    1. Black JR, Epstein E, Rains WD, Yin QZ, Casey WH (2008) Magnesium-isotope fractionation during plant growth. Environ Sci Technol 42 7831–7836 - PubMed
    1. Böhlke JK, de Laeter JR, De Bievre P, Hidaka H, Peiser HS, Rosman KJR, Taylor PDP (2005) Isotopic compositions of the elements, 2001. J Phys Chem Ref Data 34 57–67
    1. Gilmer F, Schurr U (2007) Dynamic and nutrient fluxes in the xylem. In B Sattelmacher, WJ Horst, eds, The Apoplast of Higher Plants: Compartment of Storage, Transport, and Reactions. Springer, Dordrecht, The Netherlands, pp 221–229

LinkOut - more resources