

Mechanisms of myocardium-coronary vessel interaction
- PMID: 19966048
- PMCID: PMC2838558
- DOI: 10.1152/ajpheart.00925.2009
Mechanisms of myocardium-coronary vessel interaction
Abstract
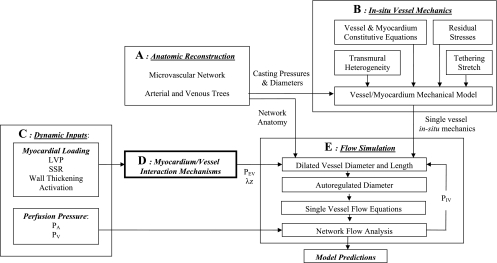
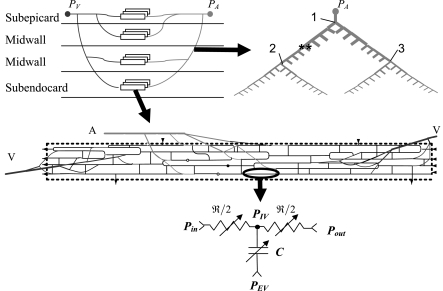
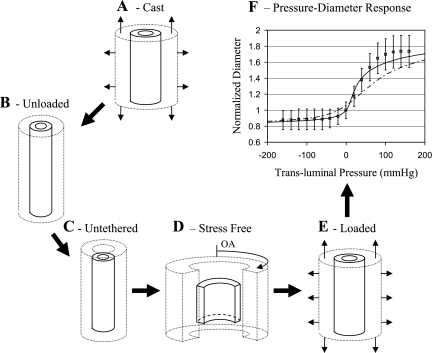
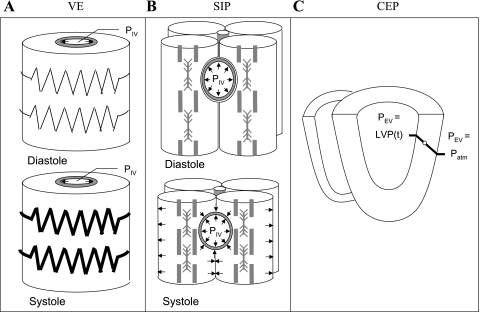
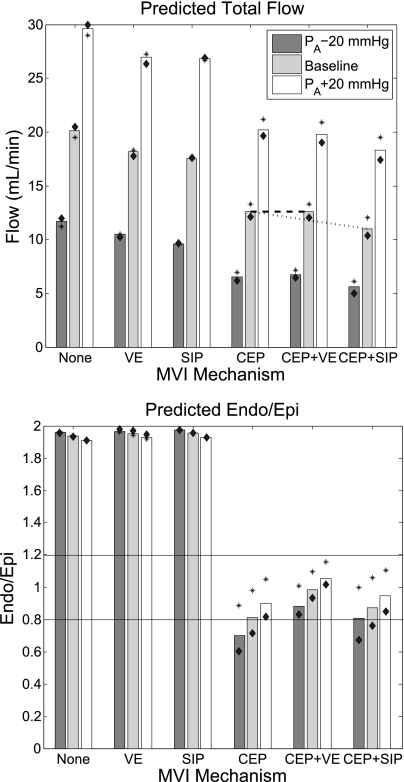
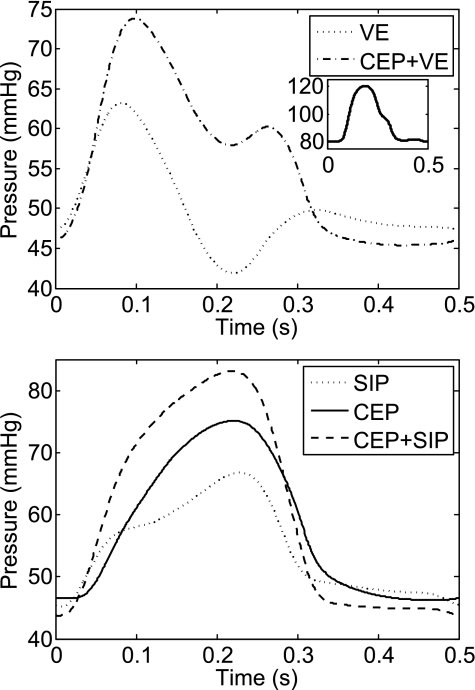
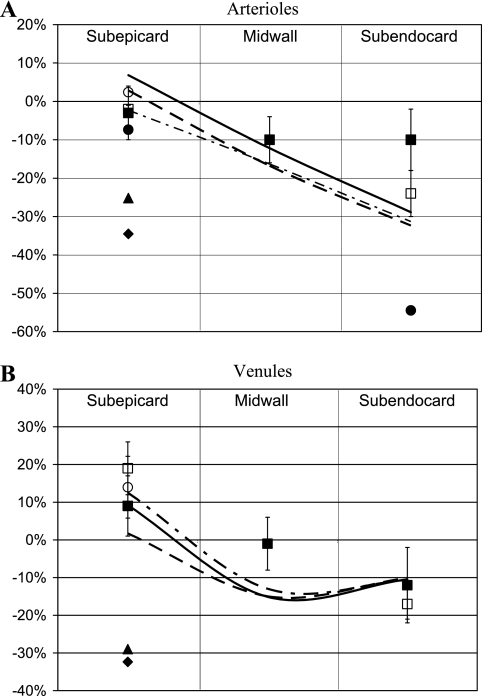
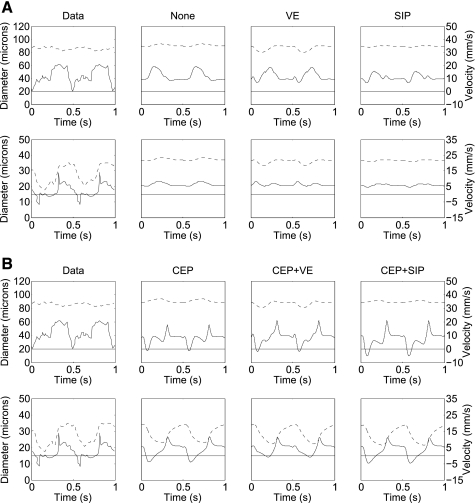
The mechanisms by which the contracting myocardium exerts extravascular forces (intramyocardial pressure, IMP) on coronary blood vessels and by which it affects the coronary flow remain incompletely understood. Several myocardium-vessel interaction (MVI) mechanisms have been proposed, but none can account for all the major flow features. In the present study, we hypothesized that only a specific combination of MVI mechanisms can account for all observed coronary flow features. Three basic interaction mechanisms (time-varying elasticity, myocardial shortening-induced intracellular pressure, and ventricular cavity-induced extracellular pressure) and their combinations were analyzed based on physical principles (conservation of mass and force equilibrium) in a realistic data-based vascular network. Mechanical properties of both vessel wall and myocardium were coupled through stress analysis to simulate the response of vessels to internal blood pressure and external (myocardial) mechanical loading. Predictions of transmural dynamic vascular pressure, diameter, and flow velocity were determined under each MVI mechanism and compared with reported data. The results show that none of the three basic mechanisms alone can account for the measured data. Only the combined effect of the cavity-induced extracellular pressure and the shortening-induced intramyocyte pressure provides good agreement with the majority of measurements. These findings have important implications for elucidating the physical basis of IMP and for understanding coronary phasic flow and coronary artery and microcirculatory disease.
Figures
Similar articles
-
A computational study of the interaction between coronary blood flow and myocardial mechanics.Physiol Meas. 2004 Aug;25(4):863-77. doi: 10.1088/0967-3334/25/4/007. Physiol Meas. 2004. PMID: 15382827
-
Dynamic interaction between myocardial contraction and coronary flow.Adv Exp Med Biol. 1997;430:123-37. doi: 10.1007/978-1-4615-5959-7_11. Adv Exp Med Biol. 1997. PMID: 9330724 Review.
-
The orientation of an intramyocardial vessel affects its mechanical loading by the surrounding myocardium.J Biomech Eng. 1993 Aug;115(3):327-8. doi: 10.1115/1.2895493. J Biomech Eng. 1993. PMID: 8231149 No abstract available.
-
Homogenization modeling for the mechanics of perfused myocardium.Prog Biophys Mol Biol. 1998;69(2-3):463-81. doi: 10.1016/s0079-6107(98)00020-0. Prog Biophys Mol Biol. 1998. PMID: 9785951
-
Pressure-flow relations in coronary circulation.Physiol Rev. 1990 Apr;70(2):331-90. doi: 10.1152/physrev.1990.70.2.331. Physiol Rev. 1990. PMID: 2181499 Review.
Cited by
-
Significance of microvascular remodelling for the vascular flow reserve in hypertension.Interface Focus. 2011 Feb 6;1(1):117-31. doi: 10.1098/rsfs.2010.0003. Epub 2010 Dec 1. Interface Focus. 2011. PMID: 22419978 Free PMC article.
-
Modeling to link regional myocardial work, metabolism and blood flows.Ann Biomed Eng. 2012 Nov;40(11):2379-98. doi: 10.1007/s10439-012-0613-5. Epub 2012 Aug 23. Ann Biomed Eng. 2012. PMID: 22915334 Free PMC article. Review.
-
Role of coronary flow regulation and cardiac-coronary coupling in mechanical dyssynchrony associated with right ventricular pacing.Am J Physiol Heart Circ Physiol. 2021 Mar 1;320(3):H1037-H1054. doi: 10.1152/ajpheart.00549.2020. Epub 2020 Dec 24. Am J Physiol Heart Circ Physiol. 2021. PMID: 33356963 Free PMC article.
-
A Closed-Loop Modeling Framework for Cardiac-to-Coronary Coupling.Front Physiol. 2022 Feb 28;13:830925. doi: 10.3389/fphys.2022.830925. eCollection 2022. Front Physiol. 2022. PMID: 35295571 Free PMC article.
-
A full 3-D reconstruction of the entire porcine coronary vasculature.Am J Physiol Heart Circ Physiol. 2010 Oct;299(4):H1064-76. doi: 10.1152/ajpheart.00151.2010. Epub 2010 Jul 9. Am J Physiol Heart Circ Physiol. 2010. PMID: 20622105 Free PMC article.
References
-
- Aliev MK, Dos Santos P, Hoerter JA, Soboll S, Tikhonov AN, Saks VA. Water content and its intracellular distribution in intact and saline perfused rat hearts revisited. Cardiovasc Res 53: 48–58, 2002 - PubMed
-
- Ashikawa K, Kanatsuka H, Suzuki T, Takishima T. Phasic blood flow velocity pattern in epimyocardial microvessels in the beating canine left ventricle. Circ Res 59: 704–711, 1986 - PubMed
-
- Bache RJ, Cobb FR. Effect of maximal coronary vasodilation on transmural myocardial perfusion during tachycardia in the awake dog. Circ Res 41: 648–653, 1977 - PubMed
-
- Bache RJ, Schwartz JS. Effect of perfusion pressure distal to a coronary stenosis on transmural myocardial blood flow. Circulation 65: 928–935, 1982 - PubMed
-
- Boatwright RB, Downey HF, Bashour FA, Crystal GJ. Transmural variation in autoregulation of coronary blood flow in hyperperfused canine myocardium. Circ Res 47: 599–609, 1980 - PubMed
Publication types
MeSH terms
Grants and funding
LinkOut - more resources
Full Text Sources
Other Literature Sources