Enhanced apoptotic propensity in diabetic cardiac mitochondria: influence of subcellular spatial location
- PMID: 19966057
- PMCID: PMC2822591
- DOI: 10.1152/ajpheart.00668.2009
Enhanced apoptotic propensity in diabetic cardiac mitochondria: influence of subcellular spatial location
Abstract
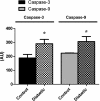
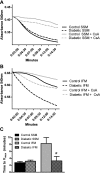
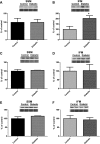
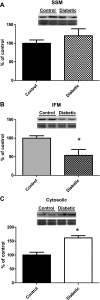
Cardiovascular complications, such as diabetic cardiomyopathy, account for the majority of deaths associated with diabetes mellitus. Mitochondria are particularly susceptible to the damaging effects of diabetes mellitus and have been implicated in the pathogenesis of diabetic cardiomyopathy. Cardiac mitochondria consist of two spatially distinct subpopulations, termed subsarcolemmal mitochondria (SSM) and interfibrillar mitochondria (IFM). The goal of this study was to determine whether subcellular spatial location is associated with apoptotic propensity of cardiac mitochondrial subpopulations during diabetic insult. Swiss Webster mice were subjected to intraperitoneal injection of streptozotocin or citrate saline vehicle. Ten weeks following injection, diabetic hearts displayed increased caspase-3 and caspase-9 activities, indicating enhanced apoptotic signaling (P < 0.05, for both). Mitochondrial size (forward scatter) and internal complexity (side scatter) were decreased in diabetic IFM (P < 0.05, for both) but not in diabetic SSM. Mitochondrial membrane potential (Delta(Psim)) was lower in diabetic IFM (P < 0.01) but not in diabetic SSM. Mitochondrial permeability transition pore (mPTP) opening was increased in diabetic compared with control IFM (P < 0.05), whereas no differences were observed in diabetic compared with control SSM. Examination of mPTP constituents revealed increases in cyclophilin D in diabetic IFM. Furthermore, diabetic IFM possessed lower cytochrome c and BcL-2 levels and increased Bax levels (P < 0.05, for all 3). No significant changes in these proteins were observed in diabetic SSM compared with control. These results indicate that diabetes mellitus is associated with an enhanced apoptotic propensity in IFM, suggesting a differential apoptotic susceptibility of distinct mitochondrial subpopulations based upon subcellular location.
Figures


Similar articles
-
Physiological and structural differences in spatially distinct subpopulations of cardiac mitochondria: influence of cardiac pathologies.Am J Physiol Heart Circ Physiol. 2014 Jul 1;307(1):H1-14. doi: 10.1152/ajpheart.00747.2013. Am J Physiol Heart Circ Physiol. 2014. PMID: 24778166 Free PMC article. Review.
-
Diabetic cardiomyopathy-associated dysfunction in spatially distinct mitochondrial subpopulations.Am J Physiol Heart Circ Physiol. 2009 Feb;296(2):H359-69. doi: 10.1152/ajpheart.00467.2008. Epub 2008 Dec 5. Am J Physiol Heart Circ Physiol. 2009. PMID: 19060128 Free PMC article.
-
Bioenergetics and permeability transition pore opening in heart subsarcolemmal and interfibrillar mitochondria: effects of aging and lifelong calorie restriction.Mech Ageing Dev. 2009 May;130(5):297-307. doi: 10.1016/j.mad.2009.01.004. Epub 2009 Jan 29. Mech Ageing Dev. 2009. PMID: 19428447 Free PMC article.
-
Proteomic alterations of distinct mitochondrial subpopulations in the type 1 diabetic heart: contribution of protein import dysfunction.Am J Physiol Regul Integr Comp Physiol. 2011 Feb;300(2):R186-200. doi: 10.1152/ajpregu.00423.2010. Epub 2010 Nov 3. Am J Physiol Regul Integr Comp Physiol. 2011. PMID: 21048079 Free PMC article.
-
Functional deficiencies of subsarcolemmal mitochondria in the type 2 diabetic human heart.Am J Physiol Heart Circ Physiol. 2014 Jul 1;307(1):H54-65. doi: 10.1152/ajpheart.00845.2013. Epub 2014 Apr 28. Am J Physiol Heart Circ Physiol. 2014. PMID: 24778174 Free PMC article.
Cited by
-
Mitochondrial Dysfunction in Diabetic Cardiomyopathy: The Possible Therapeutic Roles of Phenolic Acids.Int J Mol Sci. 2020 Aug 22;21(17):6043. doi: 10.3390/ijms21176043. Int J Mol Sci. 2020. PMID: 32842567 Free PMC article. Review.
-
Mitochondrial dysfunction in heart failure.Heart Fail Rev. 2013 Sep;18(5):607-22. doi: 10.1007/s10741-012-9340-0. Heart Fail Rev. 2013. PMID: 22948484 Free PMC article. Review.
-
Low molecular weight fucoidan alleviates cardiac dysfunction in diabetic Goto-Kakizaki rats by reducing oxidative stress and cardiomyocyte apoptosis.J Diabetes Res. 2014;2014:420929. doi: 10.1155/2014/420929. Epub 2014 Nov 30. J Diabetes Res. 2014. PMID: 25525607 Free PMC article.
-
Effects of Exercise Training on Cardiac Mitochondrial Functions in Diabetic Heart: A Systematic Review.Int J Mol Sci. 2024 Dec 24;26(1):8. doi: 10.3390/ijms26010008. Int J Mol Sci. 2024. PMID: 39795867 Free PMC article.
-
Physiological and structural differences in spatially distinct subpopulations of cardiac mitochondria: influence of cardiac pathologies.Am J Physiol Heart Circ Physiol. 2014 Jul 1;307(1):H1-14. doi: 10.1152/ajpheart.00747.2013. Am J Physiol Heart Circ Physiol. 2014. PMID: 24778166 Free PMC article. Review.
References
-
- Adhihetty PJ, Ljubicic V, Menzies KJ, Hood DA. Differential susceptibility of subsarcolemmal and intermyofibrillar mitochondria to apoptotic stimuli. Am J Physiol Cell Physiol 289: C994–C1001, 2005 - PubMed
-
- Backlund T, Palojoki E, Saraste A, Eriksson A, Finckenberg P, Kyto V, Lakkisto P, Mervaala E, Voipio-Pulkki LM, Laine M, Tikkanen I. Sustained cardiomyocyte apoptosis and left ventricular remodelling after myocardial infarction in experimental diabetes. Diabetologia 47: 325–330, 2004 - PubMed
-
- Baines CP, Kaiser RA, Purcell NH, Blair NS, Osinska H, Hambleton MA, Brunskill EW, Sayen MR, Gottlieb RA, Dorn GW, Robbins J, Molkentin JD. Loss of cyclophilin D reveals a critical role for mitochondrial permeability transition in cell death. Nature 434: 658–662, 2005 - PubMed
-
- Bojunga J, Nowak D, Mitrou PS, Hoelzer D, Zeuzem S, Chow KU. Antioxidative treatment prevents activation of death-receptor- and mitochondrion-dependent apoptosis in the hearts of diabetic rats. Diabetologia 47: 2072–2080, 2004 - PubMed
Publication types
MeSH terms
Substances
Grants and funding
LinkOut - more resources
Full Text Sources
Research Materials

