. 2010 Jan 15;184(2):658-65.
doi: 10.4049/jimmunol.0903414. Epub 2009 Dec 4.

Ins2 deficiency augments spontaneous HLA-A*0201-restricted T cell responses to insulin

Affiliations

Ins2 deficiency augments spontaneous HLA-A*0201-restricted T cell responses to insulin

Irene Jarchum et al. J Immunol. .

Abstract

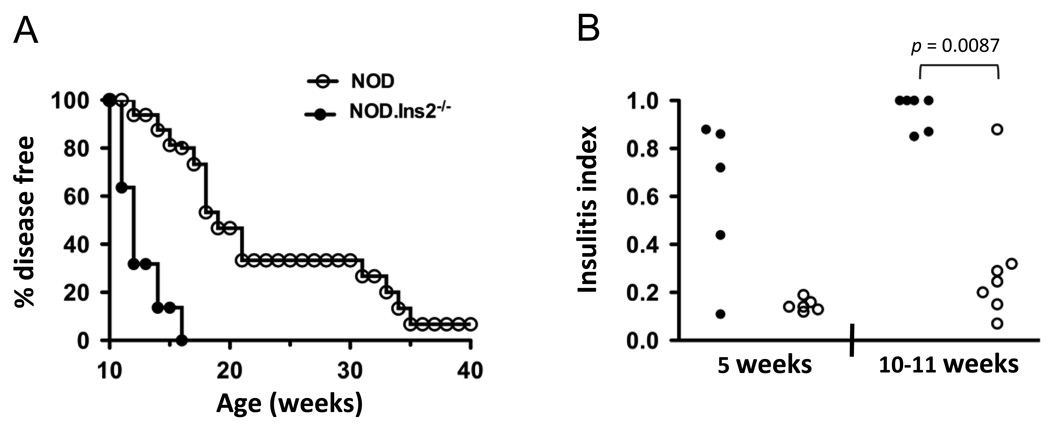
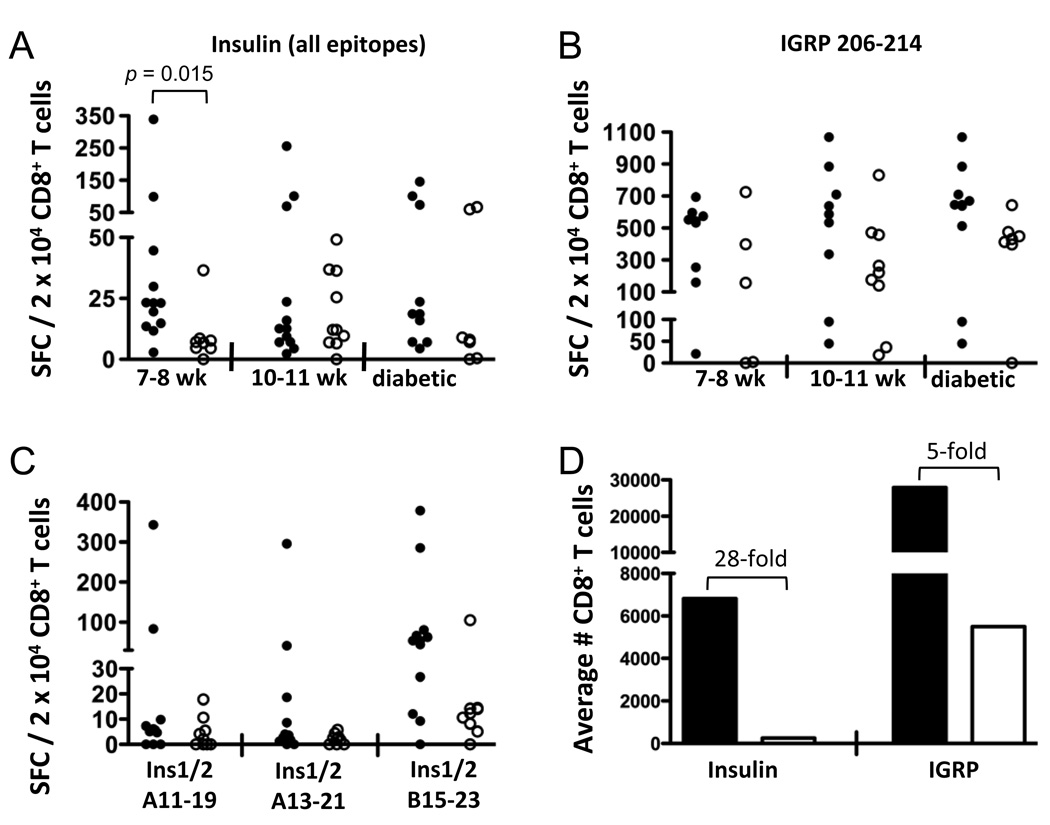
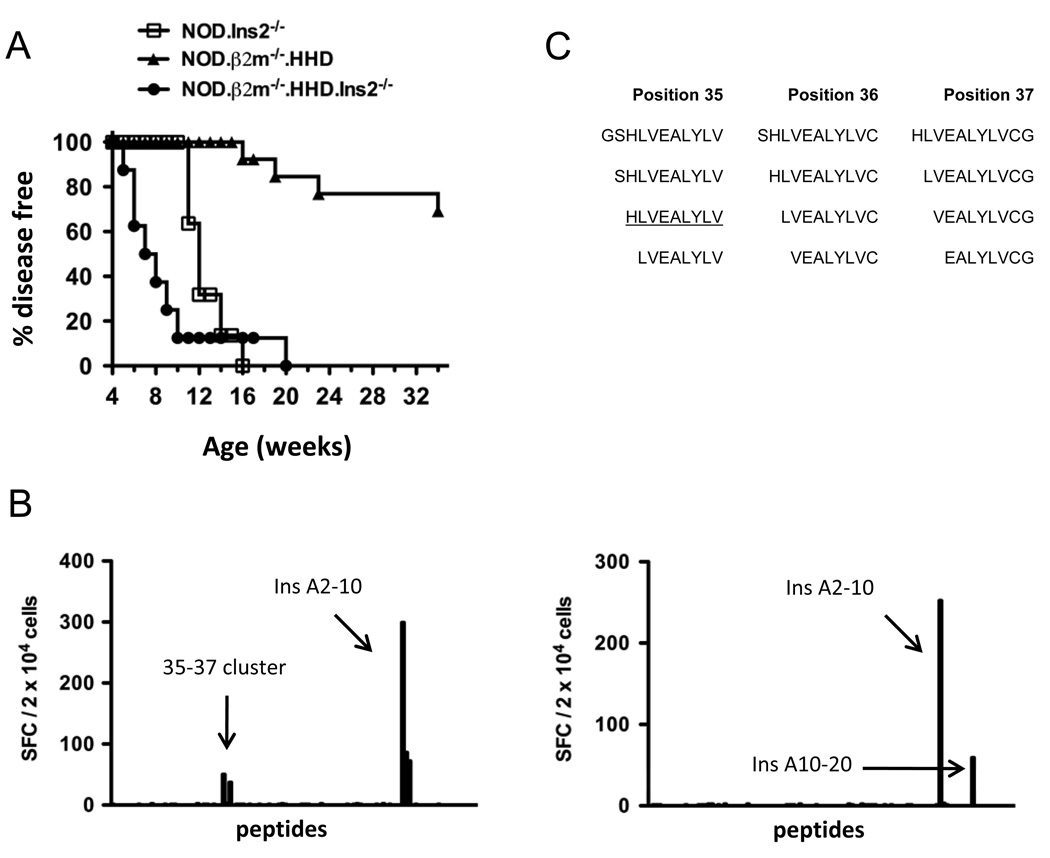
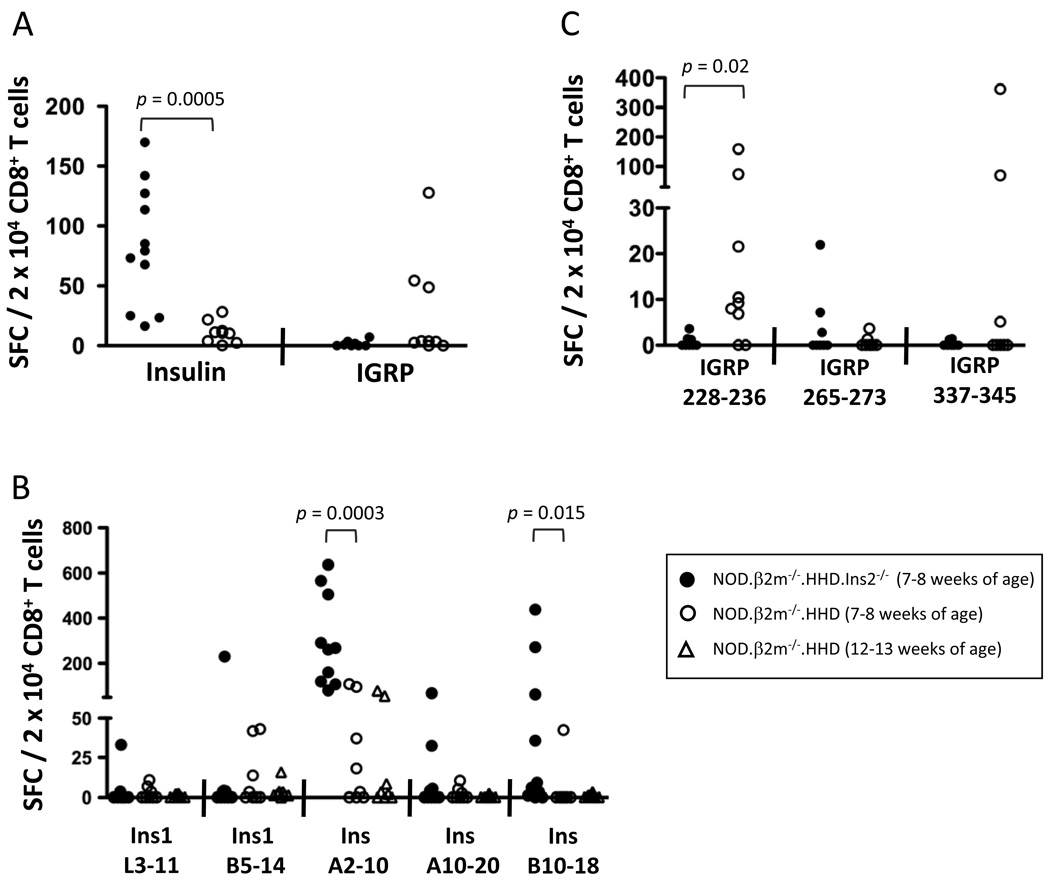
Type 1 diabetes results from the autoimmune destruction of insulin-producing beta cells by T cells specific for beta cell Ags, including insulin. In humans, the non-MHC locus conferring the strongest disease susceptibility is the insulin gene, and alleles yielding lower thymic insulin expression are predisposing. We sought to incorporate this characteristic into an HLA-transgenic model of the disease and to determine the influence of reduced thymic insulin expression on CD8+ T cell responses to preproinsulin. We examined NOD.Ins2(-/-) mice, which do not express insulin in the thymus and show accelerated disease, to determine whether they exhibit quantitative or qualitative differences in CD8+ T cell responses to preproinsulin. We also generated NOD.Ins2(-/-) mice expressing type 1 diabetes-associated HLA-A*0201 (designated NOD.beta2m(-/-).HHD.Ins2(-/-)) in an effort to obtain an improved humanized disease model. We found that CD8+ T cell reactivity to certain insulin peptides was more readily detected in NOD.Ins2(-/-) mice than in NOD mice. Furthermore, the proportion of insulin-reactive CD8+ T cells infiltrating the islets of NOD.Ins2(-/-) mice was increased. NOD.beta2m(-/-).HHD.Ins2(-/-) mice exhibited rapid onset of disease and had an increased proportion of HLA-A*0201-restricted insulin-reactive T cells, including those targeting the clinically relevant epitope Ins B10-18. Our results suggest that insulin alleles that predispose to type 1 diabetes in humans do so, at least in part, by facilitating CD8+ T cell responses to the protein. We propose the NOD.beta2m(-/-).HHD.Ins2(-/-) strain as an improved humanized disease model, in particular for studies seeking to develop therapeutic strategies targeting insulin-specific T cells.


Conflict of interest statement

DISCLOSURES

The authors have no financial conflict of interest.

Figures

FIGURE 1
FIGURE 1. Incidence of disease in female NOD.Ins2−/− mice and wildtype littermates
A, Glucosuria was measured weekly in NOD.Ins2−/− (filled symbols, n=22) and NOD mice (open symbols, n=15) until 40 weeks of age (p < 0.0001). One hundred percent of NOD.Ins2−/− and 20% of NOD females developed diabetes by 16 weeks of age. B, Histological analysis of the islet infiltration of NOD.Ins2−/− (filled symbols) and NOD mice (open symbols) at 5 and 10–11 weeks of age is reported as the insulitis index, calculated as described in Research Design and Methods. Each symbol represents one mouse. The difference in islet infiltration between NOD.Ins2−/− and NOD mice was below statistical significance at 5 weeks of age (p = 0.15), but highly significant at 10–11 weeks of age (p = 0.0087).
FIGURE 2
FIGURE 2. Novel CD8+ T cell specificities identified in the islet infiltrates of NOD.Ins2−/− mice
A, A representative experiment is shown in which a Truncated Pepset library spanning preproinsulin 1 was screened by IFN-γ ELISPOT with the cultured islet-infiltrating cells from 7-week-old female NOD (left panel) and NOD.Ins2−/− mice (right panel). The known Ins1/2 B15–23 epitope cluster and the novel cluster designated 99–101 are indicated with arrows. The data shown are representative of multiple library screens performed with islet-infiltrating cells from NOD and NOD.Ins2−/− mice of different ages. B, The minimal epitopes for the two specificities present in the 99–101 cluster were determined by testing the individual peptides with the islet-infiltrating cells (85% CD8+ T cells) of a 9-week-old mouse. The two novel epitopes, Ins1/2 A11–19 and Ins1/2 A13–21, are indicated with arrows and are both 9mers. The peptide sequences are underlined in (D), where the other peptides in the mixes corresponding to cluster 99–101 are shown. Data in (A) and (B) are background-subtracted. C, In a cell-based MHC stabilization assay, variants of Ins1/2 A11–19 and A13–21 mutated at position 9 show binding to the Db molecule. The positive control peptide for Db was MimA2 (YAIENYLEL) and for Kd, NRP-V7 (KYNKANVFL). The fluorescence index was calculated as the ratio of the average MFI in the presence of peptide divided by the average MFI in the presence of solvent alone.
FIGURE 3
FIGURE 3. CD8+ T cell reactivity to insulin epitopes in the islet infiltrates of NOD and NOD.Ins2−/− mice
A, Female NOD.Ins2−/− (filled circles) and NOD mice (open circles) of different ages (7–8 and 10–11 weeks of age) or diabetic were studied for reactivity to insulin epitopes by IFN-γ ELISPOT. The numbers of spot-forming cells in response to three insulin epitopes (Ins1/2 B15–23, A11–19, and A13–21) in each culture of islet-infiltrating cells were subtracted for PBS, normalized to the percent of CD8+ T cells (determined by flow cytometric analysis of an aliquot of each culture), and averaged. The data are expressed as the number of spot-forming cells per 2 × 10⁴ CD8+ T cells. Each data point represents one mouse or the pooled islets of multiple mice. B, Reactivity to IGRP 206–214 is shown. In (A) and (B), the group of NOD.Ins2−/− mice at 10–11 weeks of age includes mice that were diabetic. C, Reactivity of mice at 7–8 weeks of age for the individual insulin epitopes is shown. These data are normalized as in (A) to the percent of CD8+ T cells in each culture. D, The total number of islet-infiltrating CD8+ T cells reactive to insulin (the added reactivity to the three insulin epitopes) or to IGRP 206–214 is shown for NOD.Ins2−/− (black bars) and NOD mice (white bars) at 7–8 weeks of age.
FIGURE 4
FIGURE 4. NOD.β2m−/−.HHD.Ins2−/− mice show accelerated disease
A, Female NOD.β2m−/−.HHD (triangles, n=13) and NOD.β2m−/−.HHD.Ins2−/− mice (circles, n=8) were followed for disease development. The incidence of diabetes in NOD.Ins2−/− mice from Fig. 1A is included for comparison. B, Representative IFN-γ ELISPOT results are shown for the screening of the preproinsulin 1 peptide library with islet-infiltrating T cells from two female NOD.β2m−/−.HHD.Ins2−/− mice (top and bottom panels). Arrows labeled “35–37 cluster” and Ins A10–20 point to the IFN-γ responses observed in these mice that had not been previously observed in NOD.β2m−/−.HHD mice. C, The peptide sequences contained within the 35–37 cluster are shown, and the sequence of Ins B10–18 is underlined.
FIGURE 5
FIGURE 5. Altered frequency of islet-infiltrating cells specific for HLA-A*0201-restricted insulin and IGRP epitopes in NOD.β2m−/−.HHD.Ins2−/− compared to NOD.β2m−/−.HHD mice
Cultured islet-infiltrating cells from female NOD.β2m−/−.HHD (open symbols) and NOD.β2m−/−.HHD.Ins2−/− mice (filled symbols) at 7–8 weeks of age were tested by IFN-γ ELISPOT for reactivity to insulin and IGRP CD8+ T cell epitopes. A, The reactivity to all insulin (Ins A10–20, Ins B10–18, Ins1 L3–11, Ins1 B5–14, and Ins1/2 A2–10) or IGRP epitopes (IGRP 228–336, IGRP 265–273, and IGRP 337–345) studied was averaged for each mouse after background subtraction. Reactivity to the individual epitopes is shown for insulin (B) and IGRP (C). The data were normalized to the percentage of CD8+ T cells (determined by flow cytometric analysis of an aliquot of each culture). Each symbol represents an individual mouse.I(B), NOD.β2m−/−.HHD mice at 12–13 weeks of age were also examined.

Similar articles

Cited by

References

    1. Zhang L, Nakayama M, Eisenbarth GS. Insulin as an autoantigen in NOD/human diabetes. Curr. Opin. Immunol. 2008;20:111–118. - PMC - PubMed
    1. Pociot F, McDermott MF. Genetics of type 1 diabetes mellitus. Genes Immun. 2002;3:235–249. - PubMed
    1. Lucassen AM, Julier C, Beressi JP, Boitard C, Froguel P, Lathrop M, Bell JI. Susceptibility to insulin dependent diabetes mellitus maps to a 4.1 kb segment of DNA spanning the insulin gene and associated VNTR. Nat. Genet. 1993;4:305–310. - PubMed
    1. Bennett ST, Wilson AJ, Cucca F, Nerup J, Pociot F, McKinney PA, Barnett AH, Bain SC, Todd JA. IDDM2-VNTR-encoded susceptibility to type 1 diabetes: dominant protection and parental transmission of alleles of the insulin gene-linked minisatellite locus. J. Autoimmun. 1996;9:415–421. - PubMed
    1. Perez De Nanclares G, Bilbao JR, Calvo B, Vitoria JC, Vazquez F, Castano L. 5'-Insulin gene VNTR polymorphism is specific for type 1 diabetes: no association with celiac or Addison's disease. Ann. N. Y. Acad. Sci. 2003;1005:319–323. - PubMed

Publication types