

Optimal hematocrit for maximal exercise performance in acute and chronic erythropoietin-treated mice
- PMID: 19966291
- PMCID: PMC2806754
- DOI: 10.1073/pnas.0912924107
Optimal hematocrit for maximal exercise performance in acute and chronic erythropoietin-treated mice
Abstract
Erythropoietin (Epo) treatment increases hematocrit (Htc) and, consequently, arterial O(2) content. This in turn improves exercise performance. However, because elevated blood viscosity associated with increasing Htc levels may limit cardiac performance, it was suggested that the highest attainable Htc may not necessarily be associated with the highest attainable exercise capacity. To test the proposed hypothesis that an optimal Htc in acute and chronic Epo-treated mice exists--i.e., the Htc that facilitates the greatest O(2) flux during maximal exercise--Htc levels of wild-type mice were acutely elevated by administering novel erythropoiesis-stimulating protein (NESP; wtNESP). Furthermore, in the transgenic mouse line tg6 that reaches Htc levels of up to 0.9 because of constitutive overexpression of human Epo, the Htc was gradually reduced by application of the hemolysis-inducing compound phenylhydrazine (PHZ; tg6PHZ). Maximal cardiovascular performance was measured by using telemetry in all exercising mice. Highest maximal O(2) uptake (VO(2max)) and maximal time to exhaustion at submaximal exercise intensities were reached at Htc values of 0.58 and 0.57 for wtNESP, and 0.68 and 0.66 for tg6PHZ, respectively. Rate pressure product, and thus also maximal working capacity of the heart, increased with elevated Htc values. Blood viscosity correlated with VO(2max). Apart from the confirmation of the Htc hypothesis, we conclude that tg6PHZ adapted better to varying Htc values than wtNESP because of the higher optimal Htc of tg6PHZ compared to wtNESP. Of note, blood viscosity plays a critical role in limiting exercise capacity.
Conflict of interest statement
The authors declare no conflict of interest.
Figures
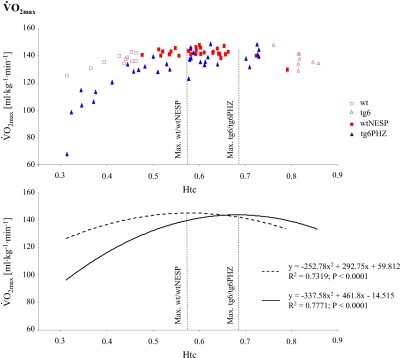
 in wtNESP and tg6PHZ mice. Single prints represent individual values. ---, regression plot of wild-type (wt)/wtNESP; —, regression plot of tg6/tg6PHZ. Also depicted are maximal
  values of wt/wtNESP (Max. wt/wtNESP) and tg6/tg6PHZ (Max. tg6/tg6PHZ).
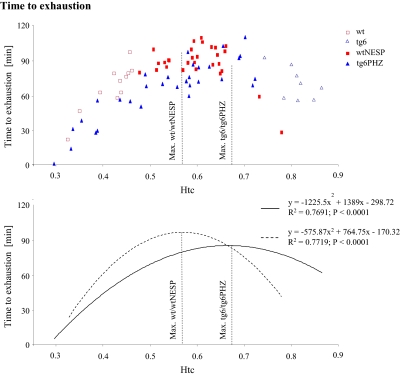
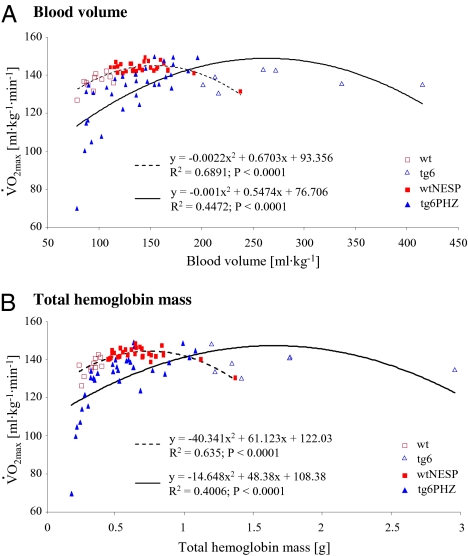 and blood volume (a) and total hemoglobin mass (b) during terminal determination in wtNESP and tg6PHZ mice. Singles prints represent individual values. ---, regression plot of wild-type (wt)/wtNESP; —, regression plot of tg6/tg6PHZ.
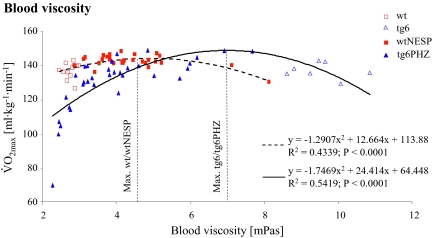 and blood viscosity during terminal determination in wtNESP and tg6PHZ mice. Singles prints represent individual values. ---, regression plot of wild-type (wt)/wtNESP; —, regression plot of tg6/tg6PHZ. Also depicted are maximal values of wt/wtNESP (Max. wt/wtNESP) and tg6/tg6PHZ (Max. tg6/tg6PHZ).
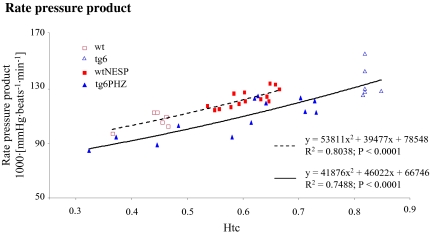 in wtNESP and tg6PHZ mice. Singles prints represent individual values. ---, regression plot of wild-type (wt)/wtNESP; —, regression plot of tg6/tg6PHZ.
References
-
- Ekblom B, Berglund B. Effect of erythropoietin administration on mammal aerobic power. Scand J Med Sci Sports. 1991;1:88–93.
-
- Ekblom B, Hermansen L. Cardiac output in athletes. J Appl Physiol. 1968;25:619–625. - PubMed
-
- Kanstrup IL, Ekblom B. Blood volume and hemoglobin concentration as determinants of maximal aerobic power. Med Sci Sports Exerc. 1984;16:256–262. - PubMed
-
- Lundby C, et al. Does recombinant human Epo increase exercise capacity by means other than augmenting oxygen transport? J Appl Physiol. 2008;105:581–587. - PubMed
-
- Robertson RJ, et al. Effect of simulated altitude erythrocythemia in women on hemoglobin flow rate during exercise. J Appl Physiol. 1988;64:1644–1649. - PubMed
Publication types
MeSH terms
Substances
LinkOut - more resources
Full Text Sources
Other Literature Sources
Medical
Molecular Biology Databases
Research Materials
