

Sociotopy in the temporoparietal cortex: common versus distinct processes
- PMID: 19966326
- PMCID: PMC2840843
- DOI: 10.1093/scan/nsp045
Sociotopy in the temporoparietal cortex: common versus distinct processes
Abstract
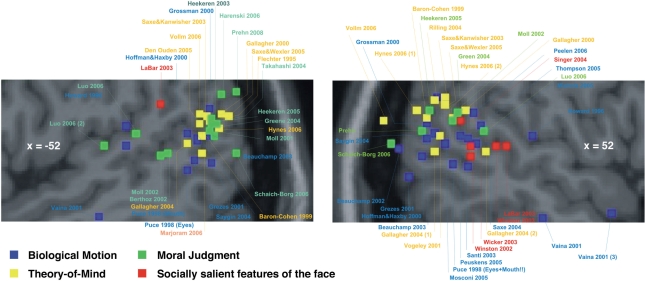
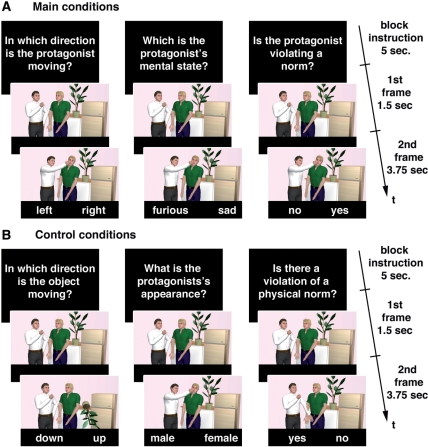
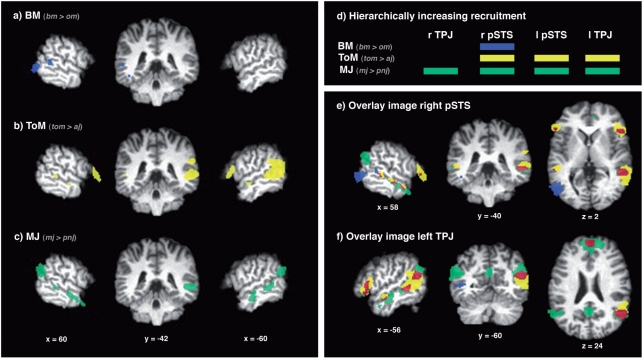
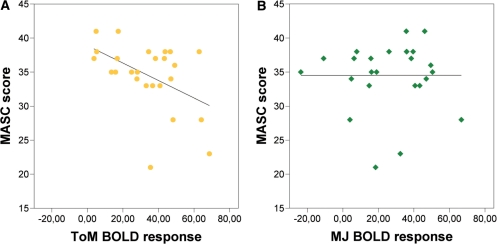
A major controversy in the social cognitive neurosciences evolved around the question whether activity in the posterior superior temporal sulcus and adjacent temporoparietal junction (pSTS/TPJ-region) evoked by various tasks represents a common process or distinct processes. To investigate this question, we employed functional magnetic resonance imaging (fMRI) while participants performed Biological Motion (BM), Theory-of-Mind (ToM) and Moral Judgment (MJ) tasks. Importantly, for each task we used the same newly developed animated stimuli. Indicative of a common process, we identified small clusters of overlapping activity for BM and ToM in right pSTS and for ToM and MJ in bilateral pSTS and left TPJ. Indicative of distinct processes, on the contrary, we detected extensive dissociable activity for BM in right pSTS, for ToM in bilateral pSTS and left TPJ, and for MJ in bilateral pSTS and TPJ. Thus, our data provide strong evidence for a combined two-staged process account: (i) the parsing of a stream of visual-spatial information, represented by activity in right pSTS, where neighboring and overlapping clusters of increased responses were found for all three tasks; (ii) increasingly more complex processing of the communicative significance of other people's behavior, represented by hierarchically increasing activity in left pSTS and bilateral TPJ elicited by ToM and MJ.
Figures
References
-
- Adolphs R. Neural systems for recognizing emotion. Current Opinion in Neurobiology. 2002;12(2):169–77. - PubMed
-
- Allison T, Puce A, McCarthy G. Social perception from visual cues: role of the STS region. Trends in Cognitive Science. 2000;4(7):267–78. - PubMed
-
- Apperly IA, Samson D, Chiavarino C, Humphreys GW. Frontal and temporo-parietal lobe contributions to theory of mind: neuropsychological evidence from a false-belief task with reduced language and executive demands. Journal of Cognitive Neuroscience. 2004;16(10):1773–84. - PubMed
-
- Baron-Cohen S, Ring HA, Wheelwright S, et al. Social intelligence in the normal and autistic brain: an fMRI study. European Journal of Neuroscience. 1999;11(6):1891–8. - PubMed
-
- Beauchamp MS, Lee KE, Haxby JV, Martin A. Parallel visual motion processing streams for manipulable objects and human movements. Neuron. 2002;34(1):149–59. - PubMed
Publication types
MeSH terms
LinkOut - more resources
Full Text Sources
Other Literature Sources
