

Population-genetic nature of copy number variations in the human genome
- PMID: 19966329
- PMCID: PMC2816609
- DOI: 10.1093/hmg/ddp541
Population-genetic nature of copy number variations in the human genome
Abstract
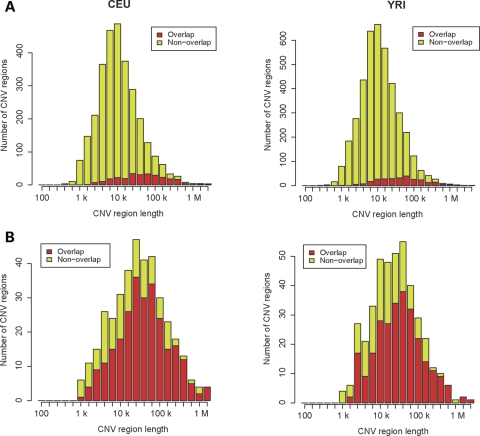
Copy number variations (CNVs) are universal genetic variations, and their association with disease has been increasingly recognized. We designed high-density microarrays for CNVs, and detected 3000-4000 CNVs (4-6% of the genomic sequence) per population that included CNVs previously missed because of smaller sizes and residing in segmental duplications. The patterns of CNVs across individuals were surprisingly simple at the kilo-base scale, suggesting the applicability of a simple genetic analysis for these genetic loci. We utilized the probabilistic theory to determine integer copy numbers of CNVs and employed a recently developed phasing tool to estimate the population frequencies of integer copy number alleles and CNV-SNP haplotypes. The results showed a tendency toward a lower frequency of CNV alleles and that most of our CNVs were explained only by zero-, one- and two-copy alleles. Using the estimated population frequencies, we found several CNV regions with exceptionally high population differentiation. Investigation of CNV-SNP linkage disequilibrium (LD) for 500-900 bi- and multi-allelic CNVs per population revealed that previous conflicting reports on bi-allelic LD were unexpectedly consistent and explained by an LD increase correlated with deletion-allele frequencies. Typically, the bi-allelic LD was lower than SNP-SNP LD, whereas the multi-allelic LD was somewhat stronger than the bi-allelic LD. After further investigation of tag SNPs for CNVs, we conclude that the customary tagging strategy for disease association studies can be applicable for common deletion CNVs, but direct interrogation is needed for other types of CNVs.
Figures


Similar articles
-
Lower linkage disequilibrium at CNVs is due to both recurrent mutation and transposing duplications.Mol Biol Evol. 2010 Jan;27(1):103-11. doi: 10.1093/molbev/msp210. Mol Biol Evol. 2010. PMID: 19745000 Free PMC article.
-
Integrated detection and population-genetic analysis of SNPs and copy number variation.Nat Genet. 2008 Oct;40(10):1166-74. doi: 10.1038/ng.238. Epub 2008 Sep 7. Nat Genet. 2008. PMID: 18776908
-
Concordance rate between copy number variants detected using either high- or medium-density single nucleotide polymorphism genotype panels and the potential of imputing copy number variants from flanking high density single nucleotide polymorphism haplotypes in cattle.BMC Genomics. 2020 Mar 4;21(1):205. doi: 10.1186/s12864-020-6627-8. BMC Genomics. 2020. PMID: 32131735 Free PMC article.
-
Copy-number variation in control population cohorts.Hum Mol Genet. 2007 Oct 15;16 Spec No. 2:R168-73. doi: 10.1093/hmg/ddm241. Hum Mol Genet. 2007. PMID: 17911159 Review.
-
Copy number variants in pharmacogenetic genes.Trends Mol Med. 2011 May;17(5):244-51. doi: 10.1016/j.molmed.2011.01.007. Epub 2011 Mar 8. Trends Mol Med. 2011. PMID: 21388883 Free PMC article. Review.
Cited by
-
Functional and population genetic features of copy number variations in two dairy cattle populations.BMC Genomics. 2020 Jan 28;21(1):89. doi: 10.1186/s12864-020-6496-1. BMC Genomics. 2020. PMID: 31992181 Free PMC article.
-
Both positive and negative selection pressures contribute to the polymorphism pattern of the duplicated human CYP21A2 gene.PLoS One. 2013 Nov 29;8(11):e81977. doi: 10.1371/journal.pone.0081977. eCollection 2013. PLoS One. 2013. PMID: 24312389 Free PMC article.
-
Family-Based Benchmarking of Copy Number Variation Detection Software.PLoS One. 2015 Jul 21;10(7):e0133465. doi: 10.1371/journal.pone.0133465. eCollection 2015. PLoS One. 2015. PMID: 26197066 Free PMC article.
-
The Growing Importance of CNVs: New Insights for Detection and Clinical Interpretation.Front Genet. 2013 May 30;4:92. doi: 10.3389/fgene.2013.00092. eCollection 2013. Front Genet. 2013. PMID: 23750167 Free PMC article.
-
Identification of genomic loci associated with Rhodococcus equi susceptibility in foals.PLoS One. 2014 Jun 3;9(6):e98710. doi: 10.1371/journal.pone.0098710. eCollection 2014. PLoS One. 2014. PMID: 24892408 Free PMC article.
References
-
- McCarroll S.A., Kuruvilla F.G., Korn J.M., Cawley S., Nemesh J., Wysoker A., Shapero M.H., de Bakker P.I., Maller J.B., Kirby A., et al. Integrated detection and population-genetic analysis of SNPs and copy number variation. Nat. Genet. 2008;40:1166–1174. - PubMed
-
- Sebat J. Major changes in our DNA lead to major changes in our thinking. Nat. Genet. 2007;39:S3–S5. - PubMed
Publication types
MeSH terms
Grants and funding
LinkOut - more resources
Full Text Sources
Other Literature Sources
Research Materials
