. 2010 Feb 5;285(6):3633-3642.
doi: 10.1074/jbc.M109.072900. Epub 2009 Dec 5.

Impairment of transforming growth factor beta signaling in caveolin-1-deficient hepatocytes: role in liver regeneration

Affiliations

Impairment of transforming growth factor beta signaling in caveolin-1-deficient hepatocytes: role in liver regeneration

Rafael Mayoral et al. J Biol Chem. .

Abstract

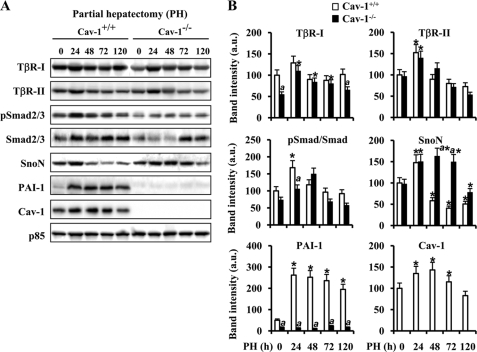
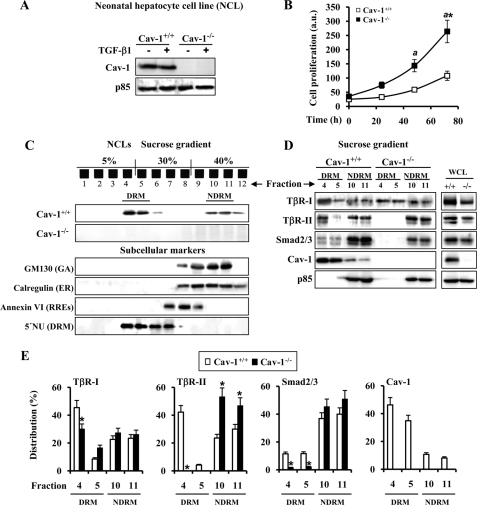
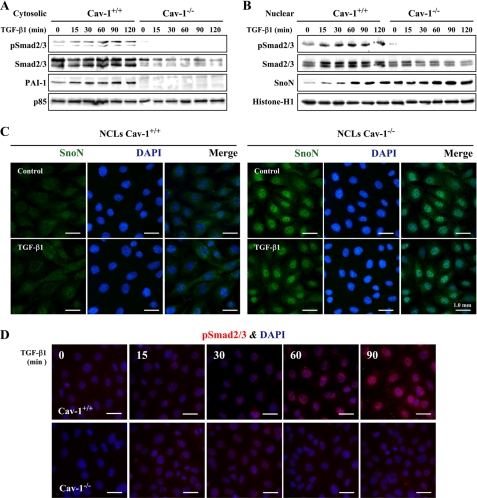
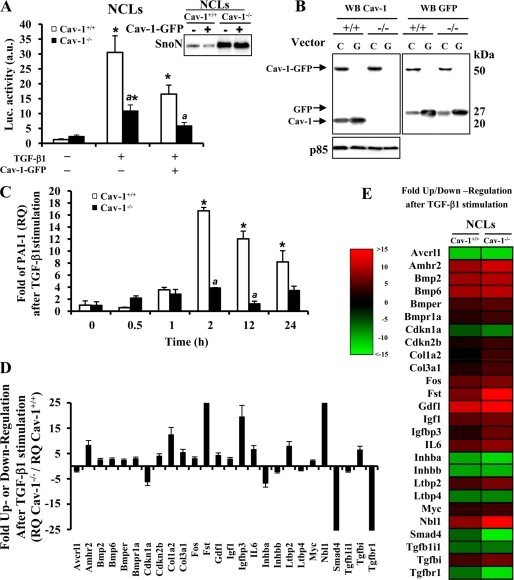
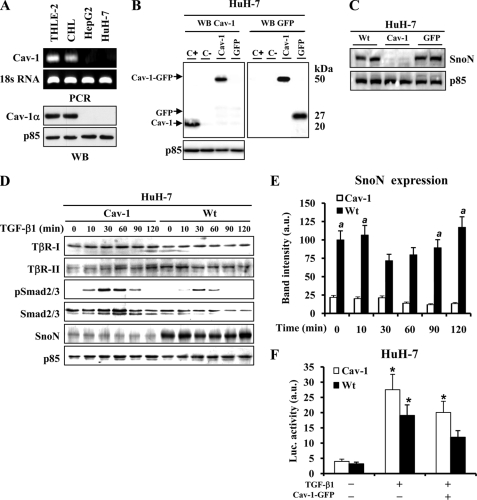
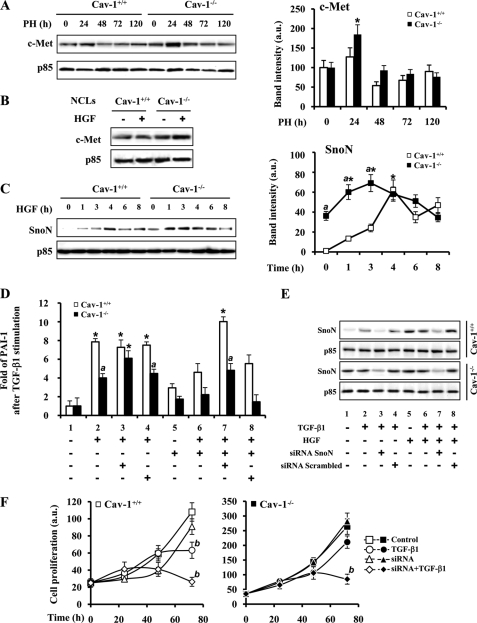
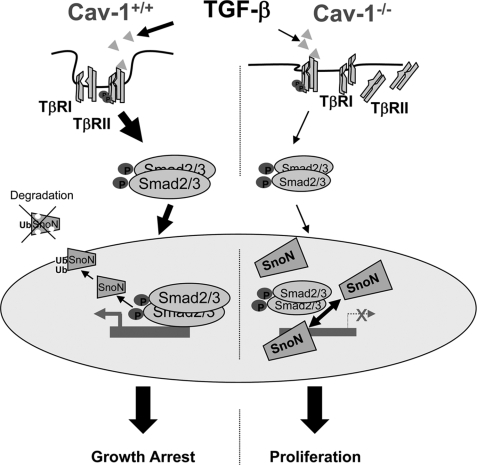
Caveolin-1 (Cav-1) is the main structural protein of caveolae and plays an important role in various cellular processes such as vesicular transport, cholesterol homeostasis, and signal transduction pathways. The expression and functional role of Cav-1 have been reported in liver and in hepatocyte cell lines, in human cirrhotic liver, and in hepatocellular carcinomas. Previous studies demonstrated that Cav-1 was dispensable for liver regeneration, because Cav-1(-/-) animals survived and fully regenerated liver function and size after partial hepatectomy. In this study, we have investigated the mechanisms by which the lack of Cav-1 accelerates liver regeneration after partial hepatectomy. The data show that transforming growth factor beta (TGF-beta) signaling is impaired in regenerating liver of Cav-1(-/-) mice and in hepatocytes derived from these animals. TGF-beta receptors I and II do not colocalize in the same membrane fraction in the hepatocytes derived from Cav-1(-/-) mice, as Smad2/3 signaling decreased in the absence of Cav-1 at the time that the transcriptional corepressor SnoN accumulates. Accordingly, the expression of TGF-beta target genes, such as plasminogen activator inhibitor-1, is decreased due to the presence of the high levels of SnoN. Moreover, hepatocyte growth factor inhibited TGF-beta signaling in the absence of Cav-1 by increasing SnoN expression. Taken together, these data might help to unravel why Cav-1-deficient mice exhibit an accelerated liver regeneration after partial hepatectomy and add new insights on the molecular mechanisms controlling the initial commitment to hepatocyte proliferation.


Figures

FIGURE 1.
FIGURE 1.
Cav-1 and TGF-β-signaling molecule expression in regenerating liver after PH. Total tissue extracts were prepared from Cav-1+/+ and Cav-1−/− remnant liver after PH at different times. A, protein levels of TβR-I and -II, total and pSmad2/3, Cav-1, SnoN, and PAI-1 were determined by Western blot. Representative blots are shown. B, densitometric analysis of the immunoblots. Data are presented as the means ± S.D. of five independent experiments (animals). *, p < 0.01 versus the corresponding value at 0 time. a, p < 0.01 versus the corresponding value at the indicated time in Cav-1+/+ mice. Blots were normalized with p85 for total extracts.
FIGURE 2.
FIGURE 2.
TβR-I/TβR-II interaction is decreased in the absence of Cav-1. A, protein levels of Cav-1 in NCL lines after treatment with 5 ng/ml TGF-β1 for 30 min. B, time-dependent proliferation of NCL Cav-1+/+ and NCL Cav-1−/− cells. Cells were seeded in medium containing 10% (v/v) FBS and, after the indicated times in culture, were trypsinized, stained with trypan blue, and counted. a.u., arbitrary units. C, sucrose discontinuous (5–30-40%) gradients were performed using a Triton X-100-based method to isolate DRM or NDRM fractions from the NCL cells as described under “Experimental Procedures.” Cav-1 is mainly localized in the fractions 4–5 in NCL Cav-1+/+ cells. GM130 (GA), calregulin (ER), annexin VI (RREs), and 5′-nucleotides (5′NU) (DRM) were used as subcellular markers. D, Western blot detection of TβR-I and II, Smad2/3, and Cav-1 in 50 μl from fractions 4 to 5 for DRM and fractions 10 to 11 for NDRM from NCL cells. Whole cell lysates (WCL) (50 μg) were used as reference for total content and blotted with the same Abs. E, quantification (%) of the distribution of the corresponding protein analyzed in D. The results are expressed as the band intensity of the protein in DRM (fractions 4 to 5) and NDRM (fractions 10 to 11) fractions with respect to the total protein levels. Representative blots are shown. Results are the means ± S.D. of four independent experiments. *, p < 0.01 versus the corresponding value at 0 time (B) or the corresponding value in NCL Cav-1+/+ (E). a, p < 0.01 versus the corresponding value at the indicated time in NCL Cav-1+/+. Blots were normalized with p85 for total extracts.
FIGURE 3.
FIGURE 3.
SnoN accumulates in NCL Cav-1−/− cells. NCL Cav-1+/+ and NCL Cav-1−/− cells (2–3 × 10⁶) were treated with 5 ng/ml TGF-β1 at the indicated times. Cytosolic (50 μg) (A) and nuclear extracts (10 μg) (B) were obtained, and protein levels of total and pSmad2/3, PAI-1, and SnoN were analyzed. A representative blot is shown. Blots were normalized with p85 for cytosolic extracts and with histone-H1 for nuclear extracts. C, immunofluorescence analysis of SnoN in NCL cells after 1 h of TGF-β1 stimulation. DAPI, 4′,6-diamidino-2-phenylindole. D, immunofluorescence analysis of pSmad2/3 in NCL cells after TGF-β1 stimulation at the indicated times. Neonatal Cav-1+/+ or Cav-1−/− cells (5 × 10⁴) were cultured in 24-multiwell plates on glass coverslips and maintained overnight with 1% FBS. After that period, the cells were fixed for 15 min with 4% paraformaldehyde, pH 7.2, washed with phosphate-buffered saline, and permeabilized with 1% Tween 20 in phosphate-buffered saline for 15 min at room temperature. After blocking with 3% bovine serum albumin for 1 h at room temperature, the cells were incubated 2 h with the corresponding Abs diluted 1:150 in 1% bovine serum albumin, washed several times, and incubated for 2 h with fluorochrome-conjugated Abs (Invitrogen) raised against Fc of primary Abs and treated with 4′,6-diamidino-2-phenylindole for 30 min at room temperature. The glass coverslips were mounting with Vectashield (Vector Laboratories, Burlingame, CA) on microscope slides. The images were acquired in a fluorescence Eclipse E400 microscope (Nikon).
FIGURE 4.
FIGURE 4.
TGF-β-responsive promoter and PAI-1 expression are impaired in the absence of Cav-1. A, NCL Cav-1+/+ and NCL Cav-1−/− cells were transfected with pEGFN1 (encoding wild-type Cav-1-GFP or GFP) and with the 3TP-Lux vectors with FuGENE-6 (Roche Applied Science) for 12 h. After 24 h of transfection, cells were treated with TGF-β1 for 12 h, and the luciferase (Luc.) activity was measured by using the luciferase assay system. Inset, SnoN expression in NCL cells after transfection with Cav-1-GFP vector. a.u., arbitrary units. B, Western blot (WB) analysis of the protein, Cav-1-GFP, GFP, or Cav-1, expressed after transfection with the pEGFPN1 vector as a control of the process (C, Cav-1; G, GFP). C, 1 μg of total RNA, extracted with TRIzol reagent (Invitrogen), was reverse-transcribed using SuperScriptTM III first-strand synthesis system for RT-PCR. Real time PCR of PAI-1 mRNA was conducted with SYBR Green on a MyiQ real time PCR system, after treatment of the cells with 5 ng/ml TGF-β1 for the indicated times. Results were normalized with the 36B4 expression and were expressed as relative quantity (RQ) (2⋀−ΔΔCt). D, after the stimulation of the NCL cells with TGF-β1 (5 ng/ml) for 90 min, RNA (2 μg) was used for cDNA synthesis with RT2 first standard kit (SuperArray Bioscience, Frederick, MD). The mouse TGF-β/BMP signaling pathway PCR array was performed according to the manufacturer's protocol, using the Profiler PCR array system and the SYBR Green/fluorescein qPCR master mix (SuperArray Bioscience) on a MyiQ real time PCR system (Bio-Rad). Gene expression was compared with the web-based software package for the PCR array system; this software automatically performs all ΔΔCt-based fold-change calculations from the specific uploaded raw threshold cycle data. E, colorimetric diagram with a selection of the 84 TGF-β signaling related genes analyzed. Genes whose transcription is up/down (red/green) 2-fold in gene expression threshold in NCL Cav-1+/+ and NCL Cav-1−/− cells are shown. All results presented are the means ± S.D. of four independent experiments. *, p < 0.01 versus the corresponding unstimulated condition. a, p < 0.01 versus the corresponding value at the same condition in NCL Cav-1+/+.
FIGURE 5.
FIGURE 5.
SnoN expression is increased in HCC cells that lack Cav-1. A, mRNA and protein levels of Cav-1 were determined by semiquantitative RT-PCR and Western blot (WB) in THLE-2, CHL, HepG2, and HuH-7 cells. B, HuH-7 cells were stably transfected with Cav-1-GFP expression vector or GFP control vector. The cells that express Cav-1-GFP or GFP were fluorescence-activated cell sorter-subcloned and selected in the presence of G418. Western blot analysis of the protein, Cav-1-GFP, GFP, or Cav-1, expressed after transfection with the pEGFPN1 vector as a control of the process (C+, CHL total extract; C−, HuH-7-WT total extract). C, SnoN expression in two different clones from HuH-7-WT, HuH-7-Cav-1, and HuH7-GFP cells. D, TGF-β-signaling molecules expression analyzed by Western blot in HuH-7-WT and HuH-7-Cav-1 cells after stimulation with TGF-β1 at the indicated times. E, densitometric analysis of SnoN protein levels from D. a.u., arbitrary units. F, HuH-7-WT and HuH-7-Cav-1 cells were transfected with pEGF-N1 and 3TP-lux vectors as described in the legend from Fig. 4A. Results are the means ± S.D. of four independent experiments. *, p < 0.01 versus the corresponding unstimulated. a, p < 0.01 versus the corresponding value at the same condition in HuH-7-Cav-1.
FIGURE 6.
FIGURE 6.
TGF-β and HGF signaling cooperate through SnoN expression to increase the proliferation of Cav-1−/− liver cells after PH. A, representative Western blot and the quantification of c-Met protein levels in total liver extracts from Cav-1+/+ and Cav-1−/− mice after PH. B, c-Met protein levels in NCL Cav-1+/+ and NCL Cav-1−/− cells after treatment with 25 ng/ml HGF for 2 h. C, induction of SnoN protein expression by treatment of the NCL cells with HGF for the indicated times. A representative Western blot and a densitometric analysis of the results are shown. D, mRNA PAI-1 levels were measured by qPCR after inhibition of SnoN expression with a specific siRNA or treatment with a scrambled control siRNA. NCL Cav-1+/+ and NCL Cav-1−/− cells were transfected during 6 h with 20 pmol of SnoN siRNA by using Lipofectamine 2000 (Invitrogen) according to manufacturer's instructions before TGF-β1 (5 ng/ml) and HGF (25 ng/ml) stimulation for 90 min. E, after transfection of the cells with siRNA and extraction of the mRNA with TRIzol used in D, SnoN protein levels were obtained from organic phase of the TRIzol extraction and analyzed by Western blot. F, 48 h after siRNA transfection, 10 × 103 cells were seeded in a 24-multiwell plate and treated with TGF-β1 (5 ng/ml). The cells were trypsinized, stained with trypan blue, and counted at the indicated times. Results are the means ± S.D. of four independent experiments. *, p < 0.01 versus the corresponding value at 0 time (C) or the corresponding unstimulated data (D). a, p < 0.01 versus the corresponding value at the indicated time (C) or stimulated data in NCL Cav-1+/+(D). b, p < 0.01 versus the corresponding untreated data at 72 h (F). Blots were normalized with p85 for total extracts. a.u., arbitrary units.
FIGURE 7.
FIGURE 7.
TGF-β signaling in Cav-1-deficient hepatocytes. In the absence of Cav-1, TβRs delocalize between the membrane and the cytoplasm, leading to a TGF-β-deficient signaling. Lesser activated Smad2/3 translocates to the nucleus, and the higher levels of SnoN impair the transcription of growth-arrest genes and enhance hepatocyte proliferation in the process of liver regeneration. In the presence of Cav-1, TGF-β signaling is sufficient to maintain the balance between cell proliferation and cell growth arrest characteristic of regenerating liver.

Similar articles

Cited by

References

    1. Yamada E. (1955) J. Biophys. Biochem. Cytol. 1, 445–458 - PMC - PubMed
    1. Razani B., Woodman S. E., Lisanti M. P. (2002) Pharmacol. Rev. 54, 431–467 - PubMed
    1. Schnitzer J. E. (2001) Adv. Drug Delivery Rev. 49, 265–280 - PubMed
    1. Fu Y., Hoang A., Escher G., Parton R. G., Krozowski Z., Sviridov D. (2004) J. Biol. Chem. 279, 14140–14146 - PubMed
    1. Okamoto T., Schlegel A., Scherer P. E., Lisanti M. P. (1998) J. Biol. Chem. 273, 5419–5422 - PubMed

Publication types

MeSH terms

Substances

LinkOut - more resources