. 2009 Dec;15(12):1392-8.
doi: 10.1038/nm.2058. Epub 2009 Nov 22.

Enhanced tonic GABAA inhibition in typical absence epilepsy

Affiliations

Enhanced tonic GABAA inhibition in typical absence epilepsy

David W Cope et al. Nat Med. 2009 Dec.

Abstract

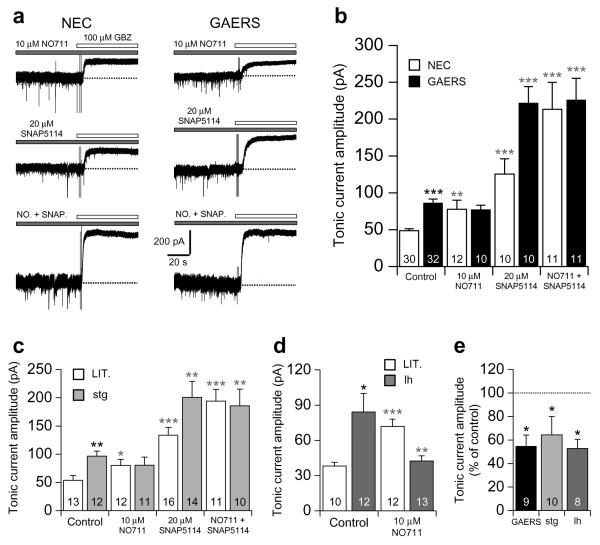
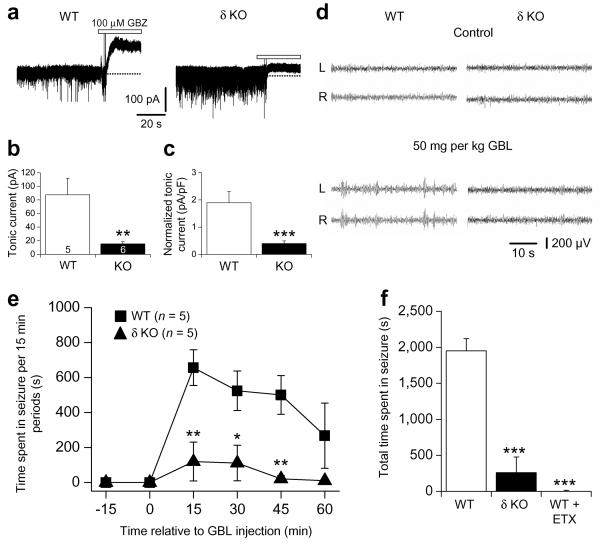
The cellular mechanisms underlying typical absence seizures, which characterize various idiopathic generalized epilepsies, are not fully understood, but impaired gamma-aminobutyric acid (GABA)-ergic inhibition remains an attractive hypothesis. In contrast, we show here that extrasynaptic GABA(A) receptor-dependent 'tonic' inhibition is increased in thalamocortical neurons from diverse genetic and pharmacological models of absence seizures. Increased tonic inhibition is due to compromised GABA uptake by the GABA transporter GAT-1 in the genetic models tested, and GAT-1 is crucial in governing seizure genesis. Extrasynaptic GABA(A) receptors are a requirement for seizures in two of the best characterized models of absence epilepsy, and the selective activation of thalamic extrasynaptic GABA(A) receptors is sufficient to elicit both electrographic and behavioral correlates of seizures in normal rats. These results identify an apparently common cellular pathology in typical absence seizures that may have epileptogenic importance and highlight potential therapeutic targets for the treatment of absence epilepsy.


Figures

Figure 1
Figure 1
Increased tonic GABAA inhibition in genetic and pharmacological models of absence seizures. (a) Representative current traces from TC neurons of P14 (upper panels) and P17 (lower panels) NEC and GAERS, indicating the presence of tonic GABAA currents following the focal application of 100 μM gabazine (GBZ, white bars). Dotted lines indicate the continuation of the initial baseline current for each neuron. (b) Comparison of the tonic current amplitude in NEC (white columns) and GAERS (black columns) at the ages indicated (P14 to P29/30). (c) Comparison of tonic current amplitude in post–seizure stargazer (stg, P19–21, light grey column), lethargic (lh, P27–30, grey column) and tottering (tg, P26–28, dark grey column) mice to respective control littermates of the same age (LIT., white columns). (d) Representative current trace from a normal Wistar rat TC neuron showing the effect of 3 μM THIP on baseline current in the presence of 0.5 μM TTX. The dotted line indicates the initial baseline current. (e) Comparison of tonic current amplitude in varying concentrations of THIP. (f) Representative current traces, in the presence of 0.5 μM TTX, from two different Wistar TC neurons showing the effect of 3 mM GHB (right) on tonic current amplitude compared to control (left). (g) Comparison of the effects of varying concentrations of GHB on tonic current amplitude, and block of GHB–induced increases by the GABABR antagonist CGP55845 (10 μM) and the putative GHB receptor antagonist NCS–382 (1 mM). Values were normalised to the average tonic current amplitude under control conditions. Experiments in (d–g) were performed on P21–26 Wistar rats. * P < 0.05, ** P < 0.01, *** P < 0.001. For (b), (c), (e) and (g), the number of recorded neurons is as indicated.
Figure 2
Figure 2
Aberrant GABA uptake by GAT–1 underlies enhanced tonic inhibition in GAERS, stargazer and lethargic. (a) Representative current traces in P18–21 NEC and GAERS showing the effects of block of GAT–1 alone (following bath application of 10 μM NO711, upper traces), GAT–3 alone (20 μM SNAP5114, middle traces), and GAT–1 and GAT–3 together (NO. + SNAP., lower traces), on tonic current amplitude, revealed by focal application of 100 μM GBZ (white bars). (b) Comparison of the effects of application of NO711 and SNAP5114 alone, and their co–application, on tonic current amplitude in NEC (white columns) and GAERS (black columns). (c) Comparison of the effect of NO711 and SNAP5114 alone, and their co–application, on tonic current amplitude in P19–21 stargazer (stg) mice (light grey columns) and control littermates (LIT., white columns). (d) Comparison of the effect of NO711 on tonic current amplitude in P27–30 lethargic (lh) mice (grey columns) and control littermates (LIT., white columns). (e) Comparison of the effect of bath application of 10 μM CGP55845 on tonic current amplitude in GAERS, stargazer and lethargic. Values were normalised to the average tonic current amplitude in the absence of CGP55845. (b), (c) and (d) * P < 0.05, ** P < 0.01 and *** P < 0.001, mutant vs. non–mutant animals under control conditions; * P < 0.05, ** P < 0.01 and *** P < 0.001, drug vs. non–drug for each strain. (e) * P < 0.05, control vs. CGP55845. For (b–e), the number of recorded neurons is as indicated.
Figure 3
Figure 3
Role of thalamic GAT–1 in the generation of SWDs. (a) Representative current traces from P68–74 wildtype (WT, left) and GAT–1 knockout (GAT–1 KO, right) mice indicating the presence of tonic currents following the focal application of 100 μM GBZ (white bars). (b) Comparison of tonic current amplitude in WT (white column) and GAT–1 KO (black column) mice. Number of recorded neurons are as indicated. (c) Simultaneous, bilateral (L = left, R = right hemispheres) EEG traces from a GAT–1 KO mouse showing spontaneous SWDs under control conditions. Below is a spectrogram corresponding to the R trace. (d) Comparison of the effect of ETX (200 mg kg−1 i.p.) on the total time (over 1 hr) spent in seizure. Number of recorded animals is as indicated. (e) Simultaneous, bilateral EEG traces from a normal Wistar rat following intra–thalamic administration of aCSF (top traces) and then 200 μM NO711 (bottom traces). Below is a spectrogram for the lowest trace L. At the bottom is an enlargement of the single SWD indicated (●). Calibration bars for the enlarged SWD; vertical 200 μV, horizontal 1 s. (f) Graph showing the effects of intra–thalamic administration of NO711 on the time (20 min periods) spent in seizure, compared to aCSF administration. (g) and (h) Comparison of the effects of systemic ETX (100 mg kg−1 i.p.) administration on total time (over 2 hrs) spent in seizure (g), and total number of SWDs (h), during intra–thalamic NO711 administration. * P < 0.05, ** P < 0.01 and *** P < 0.001.
Figure 4
Figure 4
δ subunit knockout mice exhibit reduced tonic inhibition and reduced sensitivity to GBL–induced SWDs. (a) Representative current traces from P23–30 wildtype (WT, left) and δ subunit knockout (δ KO, right) mice revealing tonic currents following the focal application of 100 μM GBZ (white bars). (b) Comparison of tonic current amplitude in WT (white column) and δ KO (black column) mice. Number of recorded neurons are as indicated. (c) Comparison of normalised tonic current amplitude for the same neurons as in (b). (d) Simultaneous, bilateral EEG traces from WT (left) and δ KO (right) mice under control conditions (top) and following injection of GBL (50 mg kg−1 i.p., bottom). (e) Graph showing the effects of GBL on the time (15 min periods) spent in seizure for WT compared to δ KO mice. (f) Comparison of the total time spent in GBL–induced seizure (over 1 hr) between WT and δ KO mice, and the effect of ETX (200 mg kg−1 i.p.) on seizures in WT mice. Number of recorded animals in (f) is the same as in (e). * P < 0.05, ** P < 0.01 and *** P < 0.001.
Figure 5
Figure 5
Spontaneous absence seizures in GAERS are reduced by intra–thalamic injection of δ subunit–specific antisense ODNs. (a) Graph showing the effect of intra–thalamic injection in GAERS of 1 and 2 nmol site−1 δ subunit–specific antisense ODNs, and 1–2 nmol site−1 non–specific missense ODN, on the time spent in seizure. Values were normalised to the time spent in seizure prior to ODN injection. (b) Comparison of the total number of SWDs following antisense (1 nmol site−1, light grey column; 2 nmol site−1, grey column) and missense (white column) ODN administration. Values were normalised to the number of seizures prior to ODN injection. (c) Effect of 2 nmol site−1 missense (white column) and 2 nmol site−1 antisense (grey column) administration on tonic current amplitude. Values were normalised to the average tonic current amplitude in age–matched, untreated GAERS. (d) Brain section showing that the spread of 2 nmol biotinylated antisense ODN is restricted to the VB thalamus 24 hrs after unilateral injection into the right hemisphere. Arrows indicate the termination of the cannulae in both hemispheres. (b) and *, P < 0.05 1 and 2 nmol antisense ODN, respectively; ** P < 0.01. (b) and (c) * P < 0.05 and ** P < 0.01. Number of animals in (b) as in (a). Number of recorded neurons in (c) is as indicated.
Figure 6
Figure 6
Selective activation of thalamic eGABAARs initiates absence seizures. (a) Simultaneous, bilateral EEG traces showing representative examples of SWDs in the first (upper traces) and second (lower traces) hour following administration of 100 μM THIP in the VB. Below is a spectrogram corresponding to the lower R trace. (b) Graph showing the effects of intra–thalamic administration of 70 and 100 μM THIP on the time (20 min periods) spent in seizure, compared to aCSF injection. (c) and (d) Comparison of the effects of systemic ETX (100 mg kg−1 i.p.) administration on total time (over 2 hrs) spent in seizure (c) and total number of SWDs (d) during intra–thalamic THIP administration. (b) ** and ‡‡ P < 0.01, 100 and 70 μM THIP vs. aCSF, respectively. (c) and (d) * P < 0.05 and ** P < 0.01. Number of animals in (c) and (d) as indicated in (b).

References

    1. Commission on Classification and Terminology of the International League Against Epilepsy Proposal for revised classification of epilepsies and epileptic syndromes. Epilepsia. 1989;30:389–399. - PubMed
    1. Crunelli V, Leresche N. Childhood absence epilepsy: genes, channels, neurons and networks. Nat. Rev. Neurosci. 2002;3:371–382. - PubMed
    1. McCormick DA, Contreras D. On the cellular and network bases of epileptic seizures. Annu. Rev. Physiol. 2001;63:815–846. - PubMed
    1. Blumenfeld H. Cellular and network mechanisms of spike-wave seizures. Epilepsia. 2005;46(Suppl. 9):21–33. - PubMed
    1. von Krosigk M, Bal T, McCormick DA. Cellular mechanisms of a synchronized oscillation in the thalamus. Science. 1993;261:361–364. - PubMed

Publication types

MeSH terms

Substances