. 2010 Jan;42(1):62-7.
doi: 10.1038/ng.495. Epub 2009 Dec 6.

Geographical genomics of human leukocyte gene expression variation in southern Morocco

Affiliations

Geographical genomics of human leukocyte gene expression variation in southern Morocco

Youssef Idaghdour et al. Nat Genet. 2010 Jan.

Abstract

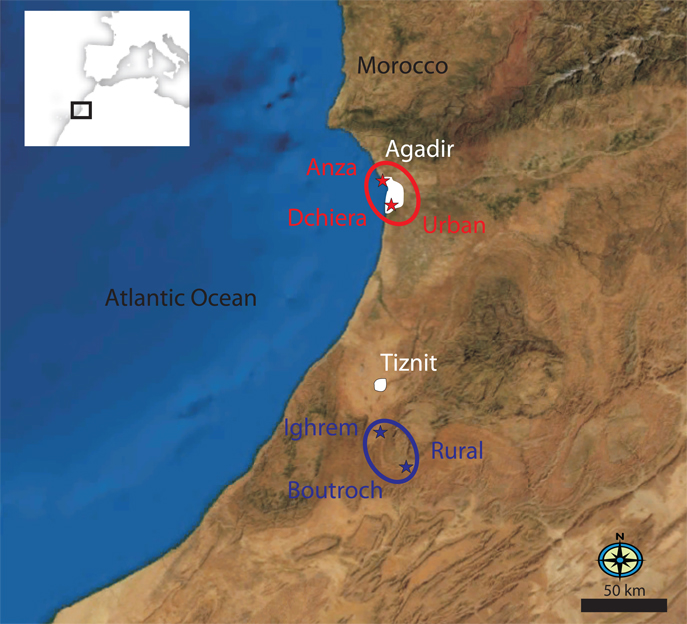
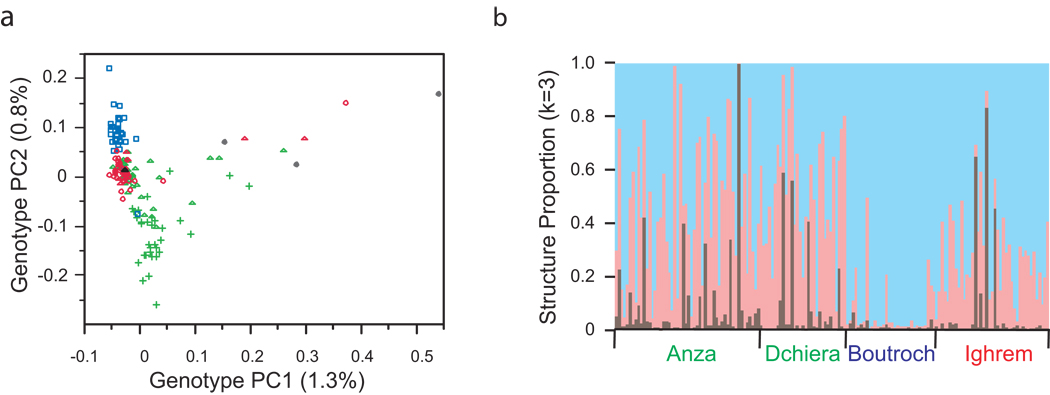
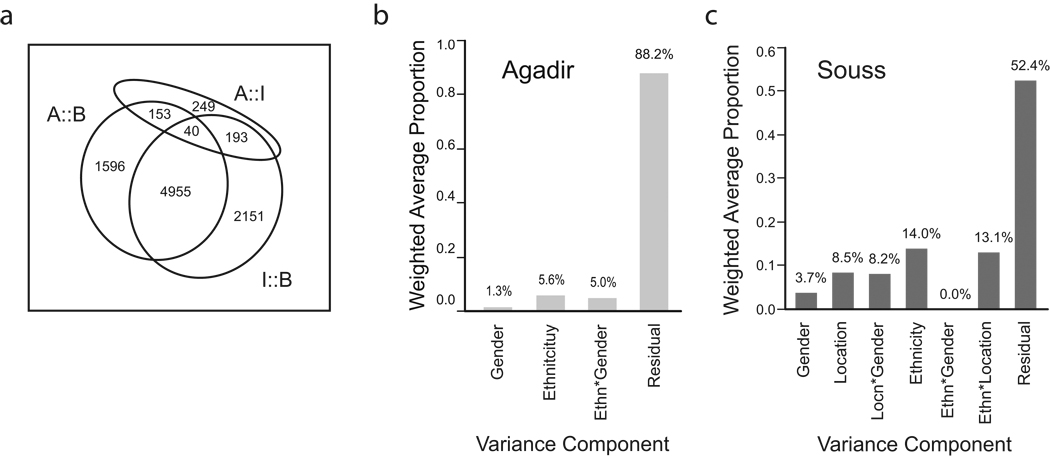
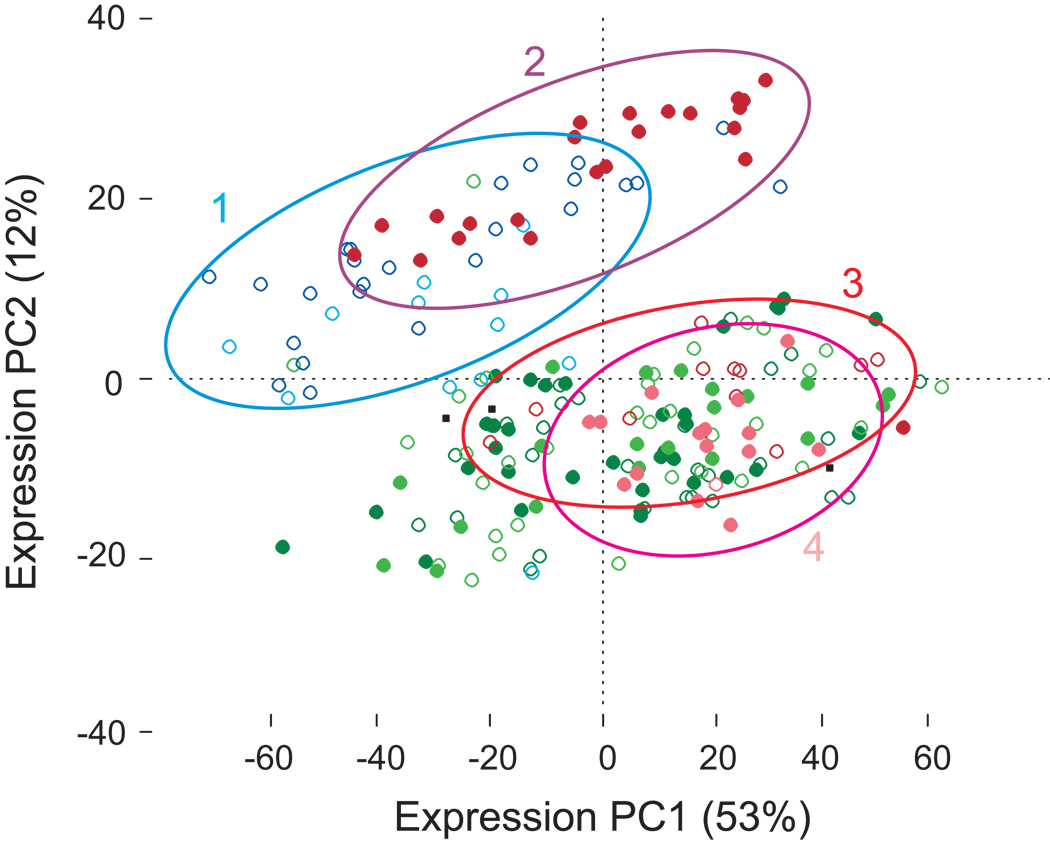
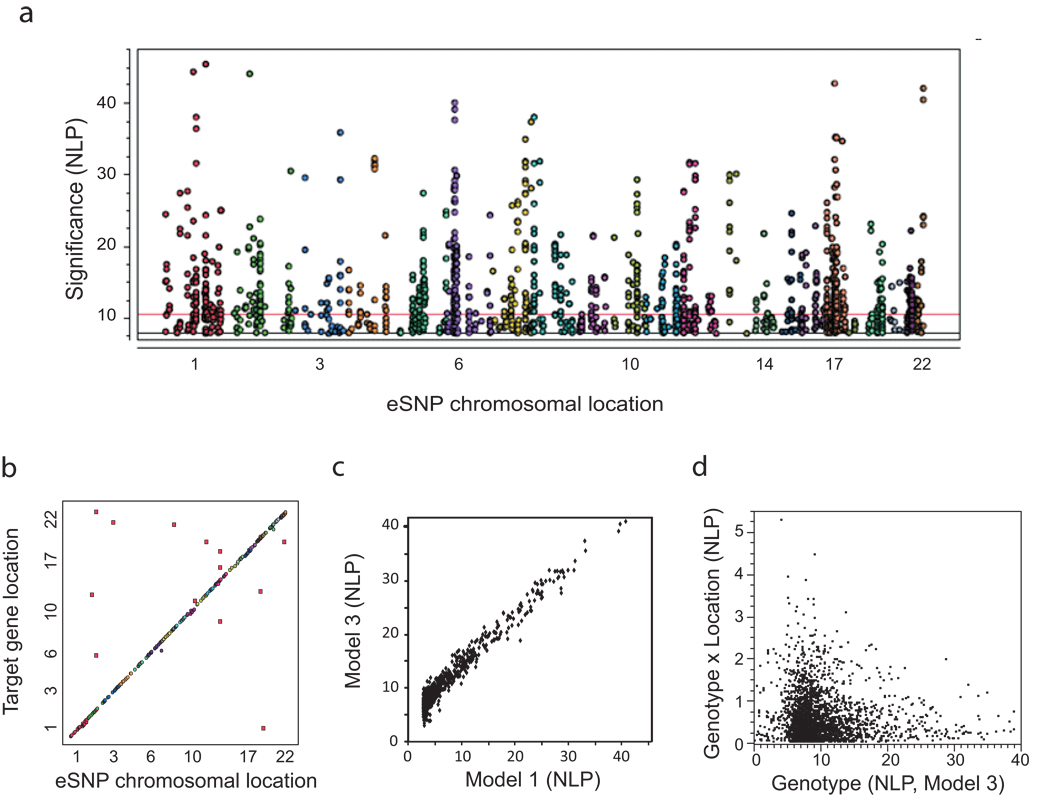
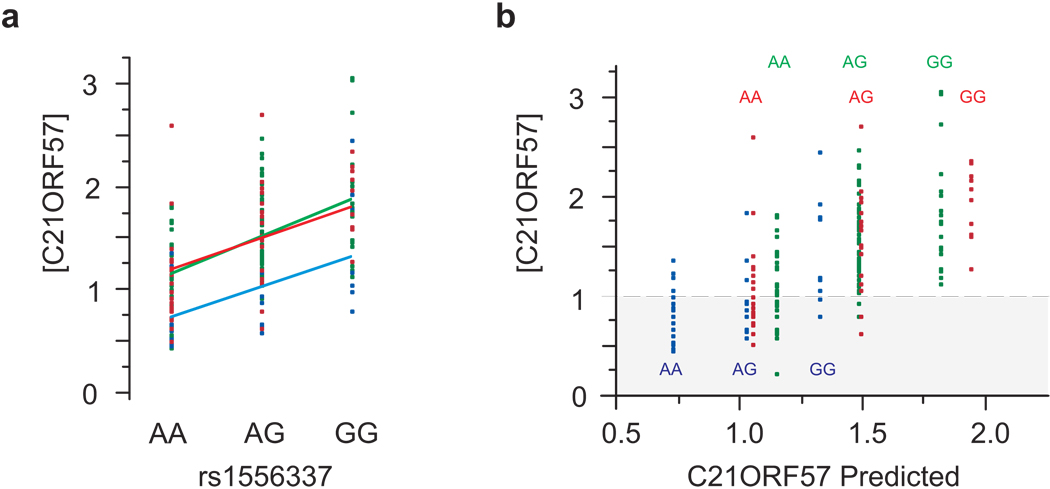
Studies of the genetics of gene expression can identify expression SNPs (eSNPs) that explain variation in transcript abundance. Here we address the robustness of eSNP associations to environmental geography and population structure in a comparison of 194 Arab and Amazigh individuals from a city and two villages in southern Morocco. Gene expression differed between pairs of locations for up to a third of all transcripts, with notable enrichment of transcripts involved in ribosomal biosynthesis and oxidative phosphorylation. Robust associations were observed in the leukocyte samples: cis eSNPs (P < 10(-08)) were identified for 346 genes, and trans eSNPs (P < 10(-11)) for 10 genes. All of these associations were consistent both across the three sample locations and after controlling for ancestry and relatedness. No evidence of large-effect trans-acting mediators of the pervasive environmental influence was found; instead, genetic and environmental factors acted in a largely additive manner.


Figures

Figure 1
Figure 1. Map of the Souss region of southern Morocco
showing the location of the two rural villages, Boutroch and Ighrem, near the town of Tiznit, relative to the urban locations Anza and Dchiera north and south of the city of Agadir, respectively.
Figure 2
Figure 2. Population structure in southern Morocco
(a)Eigenstrat principal component analysis of 579,144 SNPs reveals 7 significant eigenvectors, the first two of which, explaining just 1.3 and 0.8 % of the genotypic variance respectively, are plotted here. By self-report, Boutroch Amazigh are blue squares, Agadir Amazigh green triangles, Agadir Arabs green plus symbols, Ighrem Arabsred circles, and Ighrem Amazigh red triangles. 3 individuals with uncertain ethnicity possibly including sub-Saharan heritage, are indicated as gray spots, and have high values of PC1, which is characteristic of Yoruban ancestry as shown in Supplementary Figure 1b online. (b) Structure analysis of 16,000 autosomal SNPs, with k=3 and employing the admixture model with correlated allele frequencies, highlights the same individuals with large PC1 values (brown bars) and shows that Boutroch Amazigh are predominantly derived from one population group (pale blue) while all other samples are a mixture of the two populations represented by pale red and blue bars.
Figure 3
Figure 3. Location impacts gene expression transcriptome-wide
(a) Venn diagram of the number of genes significant at 1% FDR for ANOVA of the three pair-wise comparisons indicated. Variance components of expression variation (b) just in the 118 residents of Agadir (excluding 9 individuals with strongly positive gPC1 scores, and including reassignment of ethnicity according to gPC2 for just 11 individuals relative to self-report, Supplementary Table 5),where Ethnicity is modeled as the PC2 of the genotype variation as shown in Figure 1a, or (c) for all 22,300 probes in the full sample of 208 individuals.
Figure 4
Figure 4. Principal component plot for the most differentially expressed genes
The two major principal components of the expression of the 1,500 most significant genes shows significant separation of individuals by location (PC1 and PC2) and gender (PC2) (all P < 0.0001) as described in the text. Individuals from Boutroch are blue, Ighrem red, and Agadir green. Arabs are indicated with solid spots, Amazigh open circles, and males are lighter symbols for each color. Boutroch and Arab women from Ighrem (clusters 1 and 2) separate from Amazigh women and Arab men from Ighrem (clusters 3 and 4) who are closer to Agadir residents. If Boutroch residents and Ighrem Arab women are grouped and contrasted with Agadir residents, Ighrem Amazigh women, and Ighrem men, 8,239 genes are significantly differentially expressed at the 1% FDR rate, more than any pair-wise comparison of locations. A similar plot for all genes is shown in Supplementary Figure 11.
Figure 5
Figure 5. Genome-wide association with transcript abundance
(a)Manhattan plot of all 1,636 genome-wide associations at P < 10−8(NLP > 8) for model 3, which includes control for genotype-determined ethnicity, location, relatedness, and gender. Each chromosome is indicated by a different color. The horizontal red line indicates the genome-wide significance threshold (NLP > 11.4) for trans associations. Note the excess of peaks at the MHC complex on chromosome 6 due to multiple cis-eSNPs. (b) Cis-Trans plot showing target transcript location against eSNP location indicating that most eSNPs are in cis to the regulated transcript, while just 13 trans associations at NLP > 11.4are visible. (c) High correlation of significance measures for all eSNPs detected by simple correlation of genotype with expression (model 1) or robust control for ethnicity, gender and location (model 3). (d) Absence of genome-wide significance for the Genotype-by-Location interaction effect, which is not correlated with the Genotype effect.
Figure 6
Figure 6. The relationship between genotype, expression, and phenotype
(a) A typical example of a transcript (encoding C21ORF57, a putative metallo-proteinase) that shows both a significant difference between locations (P < 10−5) and a cis-eSNP association, with rs1556337 (P < 10−13) but no interaction effect in an additive model on the log scale. Expression is lower in Boutroch (blue points and line), while genotype has a consistent effect across all three locations (Ighrem, red; Agadir, green). (b) The Actual vs Predicted plot separates the genotypes by location for clarity. Suppose that a disease or phenotype is only seen in individuals with transcript abundance less than 1.0 (on a relative log2 scale), indicated by the gray area. Then in Agadir and Ighrem (green and red respectively) almost all affected are AA homozygotes, whereas in Boutroch (blue) heterozygotes and some GG homozygotes are also affected. There is thus a G×E interaction for the phenotype in the absence of a G×E interaction for transcription, because the environment shifts more individuals into the susceptible zone. Similar arguments would apply for phenotypes with high expression values, and for graded rather than threshold-dependent traits.

References

    1. Abegunde DO, Mathers CD, Adam T, Ortegon M, Strong K. The burden and costs of chronic diseases in low-incomeand middle-income countries. Lancet. 2007;370:1929–1938. - PubMed
    1. Cookson W, Liang L, Abecasis G, Moffatt M, Lathrop M. Mapping complex disease traits with global gene expression. Nat Rev Genet. 2009;10:184–194. - PMC - PubMed
    1. Idaghdour Y, Storey JD, Jadallah SJ, Gibson G. A genome-wide gene expression signature of environmental geography in leukocytes of Moroccan Amazighs. PLoS Genet. 2008;4:e52. - PMC - PubMed
    1. Arredi B, Poloni ES, Paracchini S, et al. A predominantly Neolithic origin for Y-chromosomal DNA variation in North Africa. Am. J. Hum. Genet. 2004;75:338–345. - PMC - PubMed
    1. Feezor RJ, et al. Whole blood and leukocyte RNA isolation for gene expression analyses. Physiol Genom. 2004;19:247–254. - PubMed

Publication types

Associated data