. 2010 Jan;13(1):53-9.
doi: 10.1038/nn.2444. Epub 2009 Dec 6.

Spike integration and cellular memory in a rhythmic network from Na+/K+ pump current dynamics

Affiliations

Spike integration and cellular memory in a rhythmic network from Na+/K+ pump current dynamics

Stefan R Pulver et al. Nat Neurosci. 2010 Jan.

Abstract

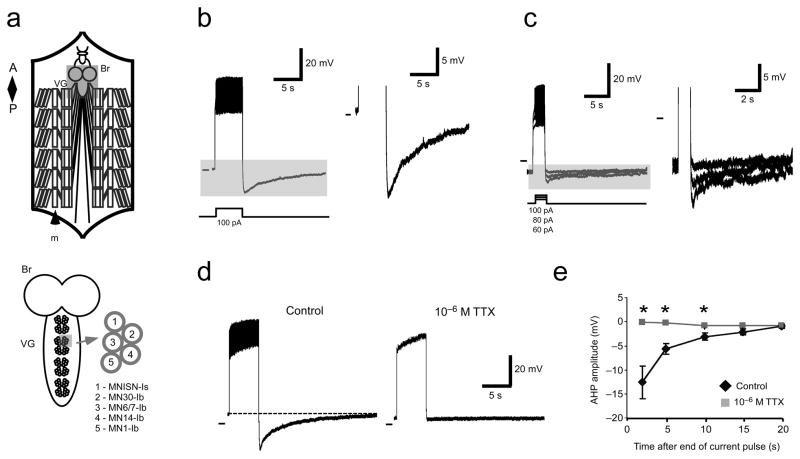
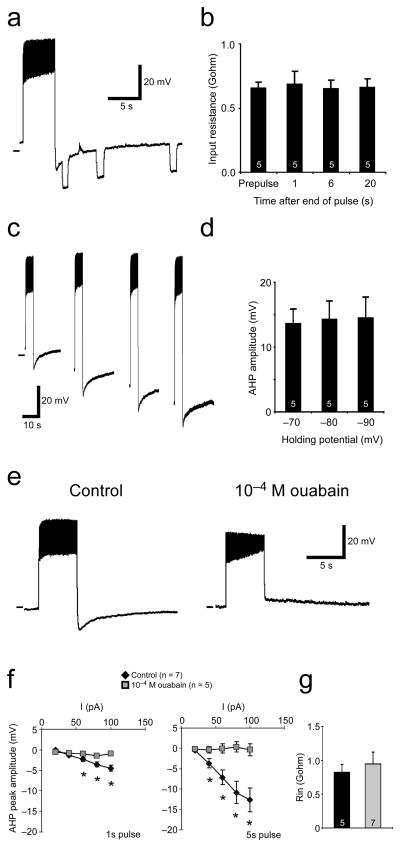
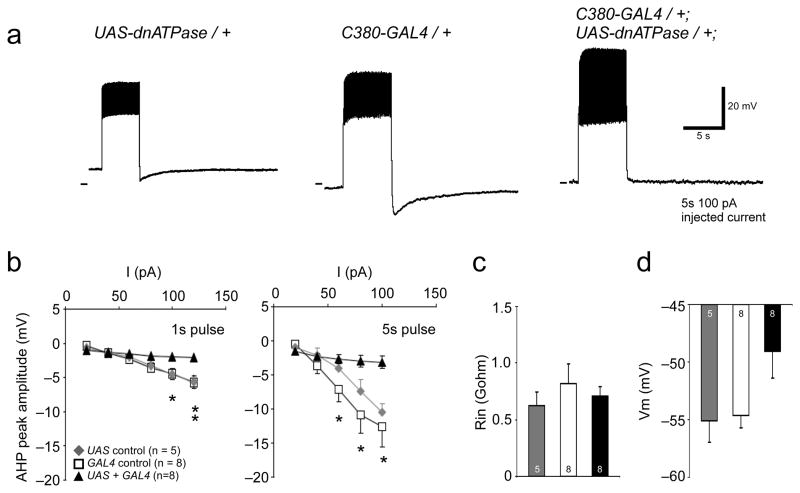
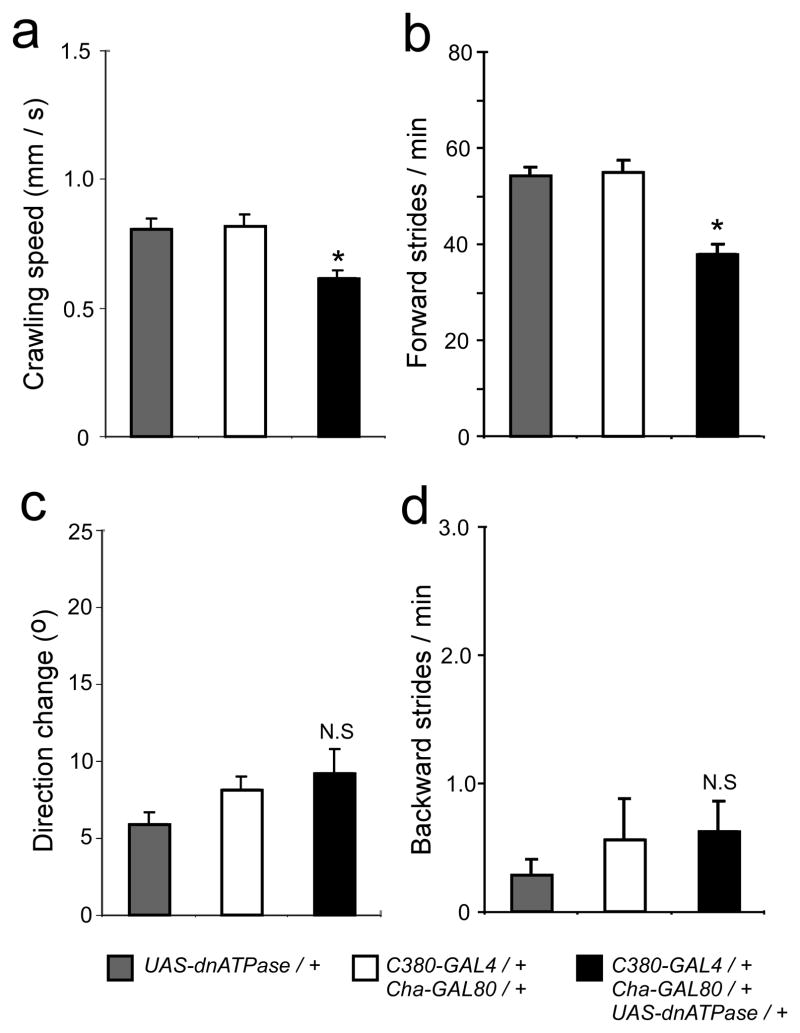
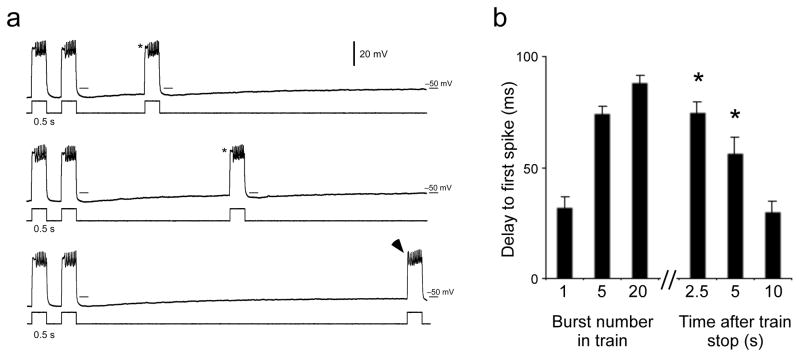
The output of a neural circuit results from an interaction between the intrinsic properties of neurons in the circuit and the features of the synaptic connections between them. The plasticity of intrinsic properties has been primarily attributed to modification of ion channel function and/or number. We have found a mechanism for intrinsic plasticity in rhythmically active Drosophila neurons that was not based on changes in ion conductance. Larval motor neurons had a long-lasting, sodium-dependent afterhyperpolarization (AHP) following bursts of action potentials that was mediated by the electrogenic activity of Na(+)/K(+) ATPase. This AHP persisted for multiple seconds following volleys of action potentials and was able to function as a pattern-insensitive integrator of spike number that was independent of external calcium. This current also interacted with endogenous Shal K(+) conductances to modulate spike timing for multiple seconds following rhythmic activity, providing a cellular memory of network activity on a behaviorally relevant timescale.


Figures

Figure 1
Figure 1
Dorsal motor neurons in 3rd instar larvae show a long lasting Na+-dependent AHP following volleys of action potentials. a) Schematic of the larval preparation (top) showing brain (Br), ventral ganglion (VG) and body wall muscles (m). Below, close view of dorsal motor neuron orientations and designations. b) Response to a 5 sec, 100 pA current injection. Shaded area is shown at right. c) Response to 1 sec current pulses (different preparation). Increasing the current injection amplitude increases the peak hyperpolarization reached. Shaded area is shown at right. d) TTX abolishes AHPs. Left, MNISN-Is response to 5 sec, 100 pA current pulses in control (left) and 106 M TTX (right). Right, pooled data. Asterisks indicate significant differences between control and TTX responses (P<0.05, Student’s T-test). Pooled data are presented as mean ± SEM.
Figure 2
Figure 2
The larval AHP shows electrophysiological and pharmacological features of a Na+/K+ pump current. a) Input resistance does not change during AHPs. Left, motor neuron response to a 5 sec, 100 pA current pulse followed by 1 sec, −5 pA pulses at 3 time points during the AHP. b) Pooled data from experiments shown in a. Input resistance was estimated from single hyperpolarizing current pulses before spiking (prepulse) and at 1, 6, and 20 sec after spiking ceased. No significant differences were observed among the time points (P>0.05, One-way ANOVA). c) AHPs do not show signs of reversing at the predicted reversal for K+ ions. Left, motor neuron responses to 5 sec current pulses at 4 different holding potentials. At each holding potential, cell is depolarized to approximately the same level. d) Pooled data for hyperpolarized holding potentials. No significant differences in AHP amplitude were observed at the various holding potentials (P>0.05, One-way ANOVA). e) Recordings from a motor neuron in control saline (left) and in ouabain (right). In ouabain, hyperpolarizing current has been injected to hold the resting potential at control levels. f) AHP amplitudes plotted as a function of injected current in control conditions (black diamonds) and in ouabain (grey squares). AHPs are almost completely abolished after both 1 and 5 sec current pulses. Asterisks indicate significant differences between control and ouabain responses (P<0.05, Student’s T-test). g) Input resistances in control and ouabain were not significantly different (P>0.05, Student’s T-test). Pooled data are presented as mean ± SEM. Sample size is indicated on histogram bars.
Figure 3
Figure 3
Expression of dominant negative Na+/K+ ATPase decreases AHP amplitude in motor neurons. a) Representative recordings from motor neurons in UAS control (left) and GAL4 control (center) and GAL4 + UAS larvae (right). Note lack of AHP in experimental conditions b) AHP amplitude plotted as a function of injected current in control conditions (squares and diamonds) and in flies expressing dnATPase (triangles). Asterisks indicate significant difference between dnATPase data (P<0.05, One-way ANOVA with Tukey HSD posthoc test). c) Input resistances were the same in control and experimental animals (P>0.05, One-way ANOVA with Tukey HSD posthoc test). d) Resting membrane potential was slightly depolarized in dnATPase expressing cells (F-value = 0.07. All pooled data are shown as mean ± SEM.
Figure 4
Figure 4
Expressing dnATPase in motor neurons decreases the cycle period of network output. (a) Animals expressing dnATPase in motor neurons crawl slower than controls. (b) Direction change during crawling is not altered by dnATPase expression. (c) The frequency of forward peristalsis is reduced in animals expressing dnATPase. (d) The frequency of backwards peristalsis is unaffected by dnATPase expression. Asterisks indicate significant differences from controls ((P<0.05, One-way ANOVA, Tukey HSD posthoc test). All pooled data are shown as mean ± SEM.
Figure 5
Figure 5
AHP amplitude is proportional to spike number regardless of activity pattern. a) MN30-Ib cell response to a 5 sec, 20 pA depolarization (left), and 5 sec of 40 pA rhythmic depolarizations (1 Hz, 0.5 sec duration) (right). b) AHP amplitude in MN30-Ib cells at various current injection levels for the two stimulus patterns. c) AHP amplitude as a function of total spike number after constant and rhythmic stimuli. d, e) MNISN-Is cell AHPs after 1 sec and 5 sec constant pulses. All pooled data are presented as mean ± SEM.
Figure 6
Figure 6
AHPs release Shal-type IA channels from inactivation and modify motor neuron intrinsic properties during behaviorally relevant rhythmic depolarization. a) MN30-Ib response to a train of depolarizing stimuli (40 pA, 1Hz, 0.5 sec duration). b) Close views of bursts 1, 5, and 20. Note delay to first spike in later cycles. Gray line denotes initial resting membrane potential. c) Delay to first spike plotted as a function of cycle number for two levels of current injection. d) Initial and final delay to first spike for 4 levels of current injection. e) Membrane potential before initial and final bursts at various current injection levels. f) Spike frequency within initial and final bursts at various current injection levels. All pooled data are presented as mean ± SEM. Asterisks indicate P<0.05, Student’s T-test.
Figure 7
Figure 7
AHPs are able to hold intrinsic properties in states approximating those seen during rhythmic activity even in the absence of rhythmic inputs. a) MN30-Ib cell responses to 40 pA current injections at various times following a 20 sec train of rhythmic depolarizing stimuli (40 pA, 1Hz, 0.5 sec duration). Last two bursts of the train are shown at left. The delay to first spike at the end of the train persists for multiple seconds (asterisks) even though the cell is not being driven rhythmically. As Vm returns to rest, the delay to first spike is lost (arrowhead). b) Average delay to first spike in the 1st, 5th and 20th bursts of a train, followed by average delays at 2.5, 5, 10 sec after cessation of train. Asterisks indicate times at which delay to first spike is significantly longer than 1st burst (P < 0.05, One-way ANOVA, with Tukey HSD posthoc test). All pooled data are shown as mean ± SEM.

Comment in

  • Ion pumps get more glamorous.
    Glanzman DL. Glanzman DL. Nat Neurosci. 2010 Jan;13(1):4-5. doi: 10.1038/nn0110-4. Nat Neurosci. 2010. PMID: 20033078 No abstract available.

References

    1. Cavazzini M, Bliss T, Emptage N. Ca2+ and synaptic plasticity. Cell Calcium. 2005;38:355–367. - PubMed
    1. Cudmore RH, Turrigiano GG. Long-term potentiation of intrinsic excitability in LV visual cortical neurons. J Neurophysiol. 2004;92:341–348. - PubMed
    1. Liu Z, Golowasch J, Marder E, Abbott LF. A model neuron with activity-dependent conductances regulated by multiple calcium sensors. J Neurosci. 1998;18:2309–2320. - PMC - PubMed
    1. Turrigiano G, Abbott LF, Marder E. Activity-dependent changes in the intrinsic properties of cultured neurons. Science. 1994;264:974–977. - PubMed
    1. Koch C. Biophysics of Computation. Oxford University Press; Oxford: 1999.

Publication types

MeSH terms

LinkOut - more resources