

Comparison of hemodynamics of intracranial aneurysms between MR fluid dynamics using 3D cine phase-contrast MRI and MR-based computational fluid dynamics
- PMID: 19967532
- PMCID: PMC3985813
- DOI: 10.1007/s00234-009-0634-4
Comparison of hemodynamics of intracranial aneurysms between MR fluid dynamics using 3D cine phase-contrast MRI and MR-based computational fluid dynamics
Abstract
Introduction: Hemodynamics is thought to play a very important role in the initiation, growth, and rupture of intracranial aneurysms. The purpose of our study was to compare hemodynamics of intracranial aneurysms of MR fluid dynamics (MRFD) using 3D cine PC MR imaging (4D-Flow) at 1.5 T and MR-based computational fluid dynamics (CFD).
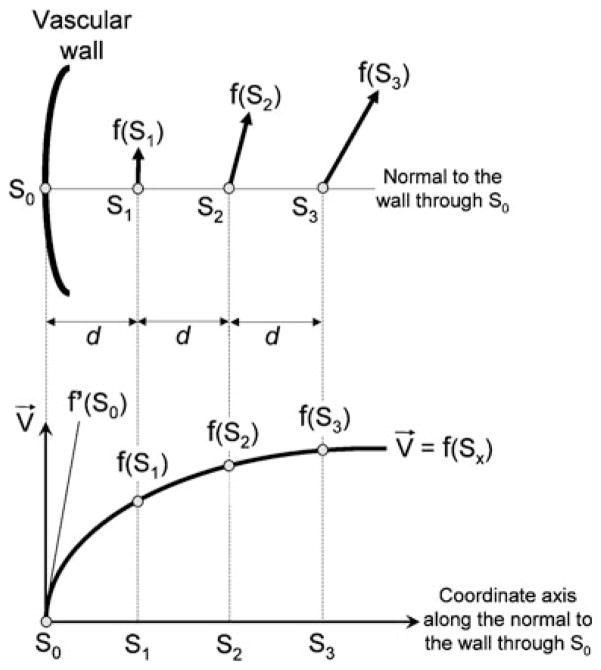
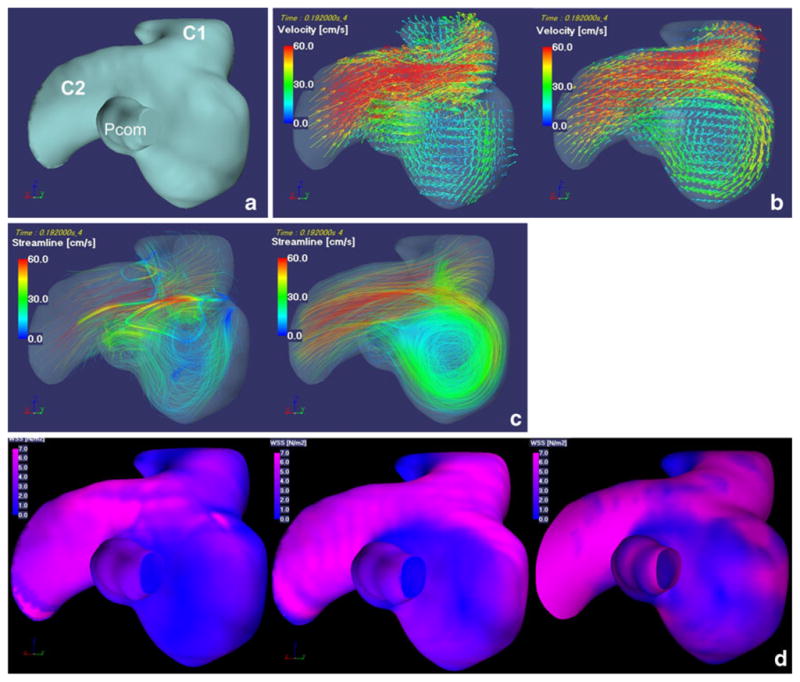
Methods: 4D-Flow was performed for five intracranial aneurysms by a 1.5 T MR scanner. 3D TOF MR angiography was performed for geometric information. The blood flow in the aneurysms was modeled using CFD simulation based on the finite element method. We used MR angiographic data as the vascular models and MR flow information as boundary conditions in CFD. 3D velocity vector fields, 3D streamlines, shearing velocity maps, wall shear stress (WSS) distribution maps and oscillatory shear index (OSI) distribution maps were obtained by MRFD and CFD and were compared.
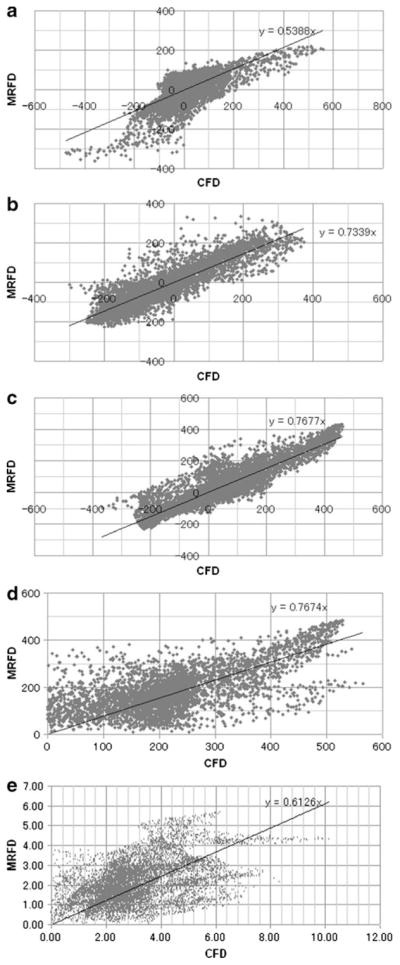
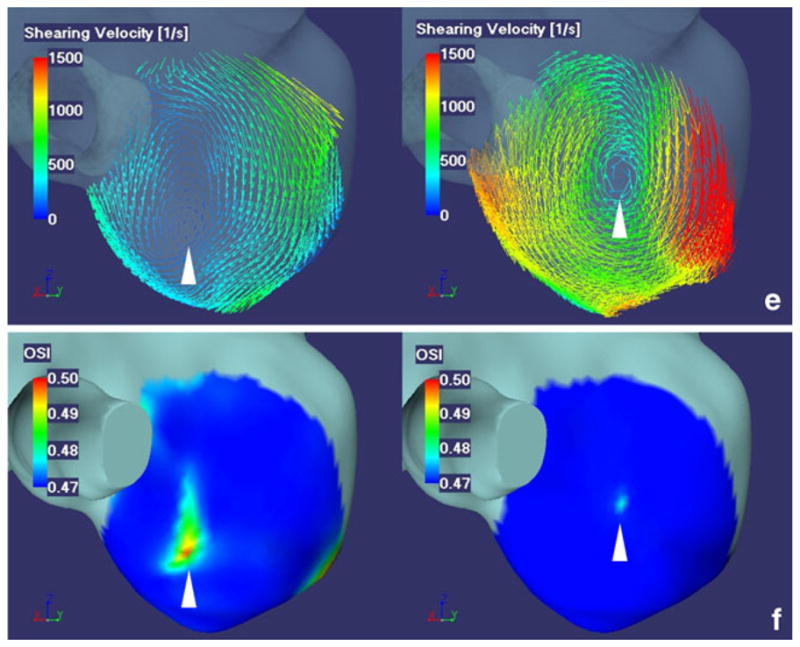
Results: There was a moderate to high degree of correlation in 3D velocity vector fields and a low to moderate degree of correlation in WSS of aneurysms between MRFD and CFD using regression analysis. The patterns of 3D streamlines were similar between MRFD and CFD. The small and rotating shearing velocities and higher OSI were observed at the top of the spiral flow in the aneurysms. The pattern and location of shearing velocity in MRFD and CFD were similar. The location of high oscillatory shear index obtained by MRFD was near to that obtained by CFD.
Conclusion: MRFD and CFD of intracranial aneurysms correlated fairly well.
Conflict of interest statement
Figures
Similar articles
-
In vivo hemodynamic analysis of intracranial aneurysms obtained by magnetic resonance fluid dynamics (MRFD) based on time-resolved three-dimensional phase-contrast MRI.Neuroradiology. 2010 Oct;52(10):921-8. doi: 10.1007/s00234-009-0635-3. Epub 2009 Dec 11. Neuroradiology. 2010. PMID: 20012431
-
3D cine phase-contrast MRI at 3T in intracranial aneurysms compared with patient-specific computational fluid dynamics.AJNR Am J Neuroradiol. 2013 Sep;34(9):1785-91. doi: 10.3174/ajnr.A3484. Epub 2013 Apr 18. AJNR Am J Neuroradiol. 2013. PMID: 23598829 Free PMC article.
-
Assessing the Risk of Intracranial Aneurysm Rupture Using Morphological and Hemodynamic Biomarkers Evaluated from Magnetic Resonance Fluid Dynamics and Computational Fluid Dynamics.Magn Reson Med Sci. 2020 Dec 1;19(4):333-344. doi: 10.2463/mrms.mp.2019-0107. Epub 2020 Jan 17. Magn Reson Med Sci. 2020. PMID: 31956175 Free PMC article.
-
A comparison of 4D flow MRI-derived wall shear stress with computational fluid dynamics methods for intracranial aneurysms and carotid bifurcations - A review.Magn Reson Imaging. 2018 May;48:62-69. doi: 10.1016/j.mri.2017.12.005. Epub 2017 Dec 6. Magn Reson Imaging. 2018. PMID: 29223732 Review.
-
Computational Fluid Dynamics for Cerebral Aneurysms in Clinical Settings.Acta Neurochir Suppl. 2021;132:27-32. doi: 10.1007/978-3-030-63453-7_4. Acta Neurochir Suppl. 2021. PMID: 33973025 Review.
Cited by
-
Computational modeling and flow diverters: a teaching moment.AJNR Am J Neuroradiol. 2011 Jun-Jul;32(6):981-3. doi: 10.3174/ajnr.A2711. Epub 2011 May 26. AJNR Am J Neuroradiol. 2011. PMID: 21622579 Free PMC article. No abstract available.
-
Parent artery curvature influences inflow zone location of unruptured sidewall internal carotid artery aneurysms.AJNR Am J Neuroradiol. 2015 Feb;36(2):342-8. doi: 10.3174/ajnr.A4122. Epub 2014 Sep 18. AJNR Am J Neuroradiol. 2015. PMID: 25234030 Free PMC article.
-
In vivo hemodynamic analysis of intracranial aneurysms obtained by magnetic resonance fluid dynamics (MRFD) based on time-resolved three-dimensional phase-contrast MRI.Neuroradiology. 2010 Oct;52(10):921-8. doi: 10.1007/s00234-009-0635-3. Epub 2009 Dec 11. Neuroradiology. 2010. PMID: 20012431
-
Characterization of Maximum Wall Shear Stress Points in Unruptured Cerebral Aneurysms Using Four-dimensional Flow Magnetic Resonance Imaging.Clin Neuroradiol. 2024 Dec;34(4):899-906. doi: 10.1007/s00062-024-01436-w. Epub 2024 Jul 17. Clin Neuroradiol. 2024. PMID: 39017672
-
The application of computational fluid dynamics in hepatic portal vein haemodynamics research: a narrative review.Quant Imaging Med Surg. 2025 Mar 3;15(3):2605-2620. doi: 10.21037/qims-24-1593. Epub 2025 Feb 26. Quant Imaging Med Surg. 2025. PMID: 40160636 Free PMC article. Review.
References
-
- Press W, Teukolsky S, Vetterling W, et al. Numerical recipes in C. Cambridge University Press; Cambridge: 1992.
-
- Malek AM, Alper SL, Izumo S. Hemodynamic shear stress and its role in atherosclerosis. JAMA. 1999;282:2035–2042. - PubMed
-
- He X, Ku DN. Pulsatile flow in the human left coronary artery bifurcation: average conditions. J Biomech Eng. 1996;118:74–82. - PubMed
-
- Hollnagel DI, Summers PE, Kollias SS, Poulikakos D. Laser Doppler velocimetry (LDV) and 3D phase-contrast magnetic resonance angiography (PC-MRA) velocity measurements: validation in an anatomically accurate cerebral artery aneurysm model with steady flow. J Magn Reson Imaging. 2007;26:1493–1505. - PubMed
Publication types
MeSH terms
Grants and funding
LinkOut - more resources
Full Text Sources
Medical
Research Materials
Miscellaneous
