. 2009 Dec;97(6):977-91.
doi: 10.1037/a0016076.

Alone in the crowd: the structure and spread of loneliness in a large social network

Affiliations

Alone in the crowd: the structure and spread of loneliness in a large social network

John T Cacioppo et al. J Pers Soc Psychol. 2009 Dec.

Abstract

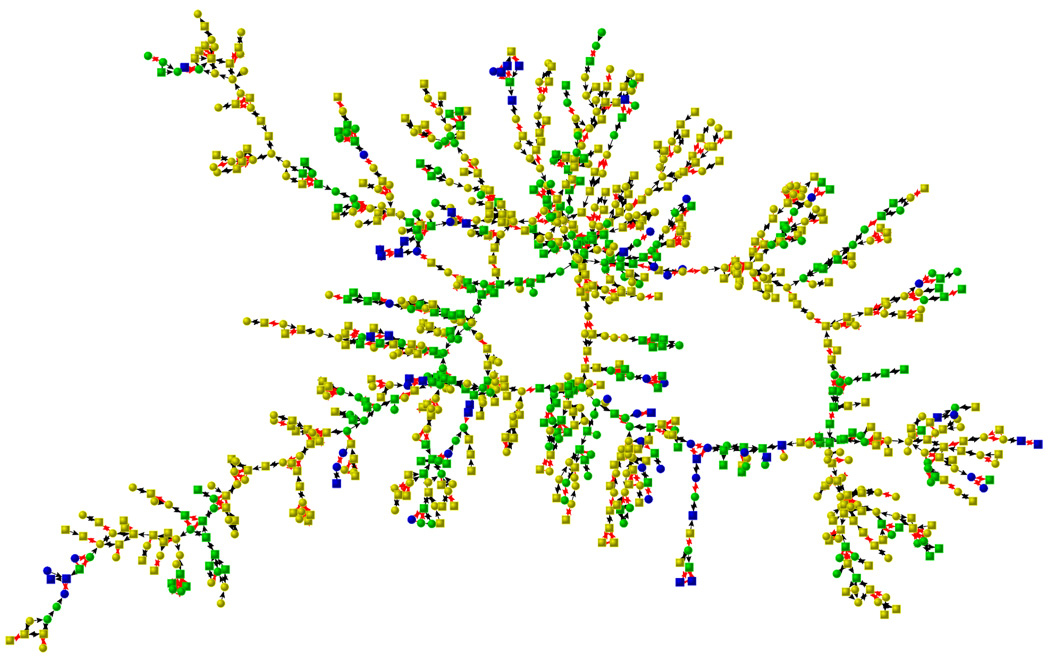
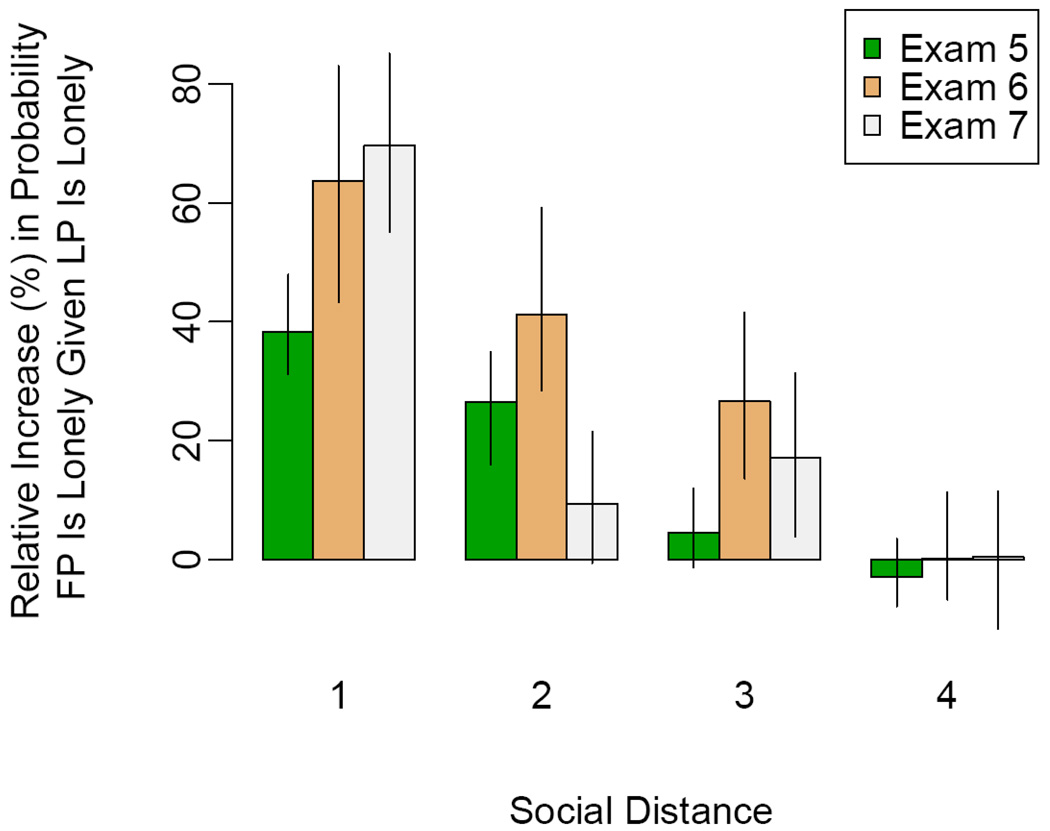
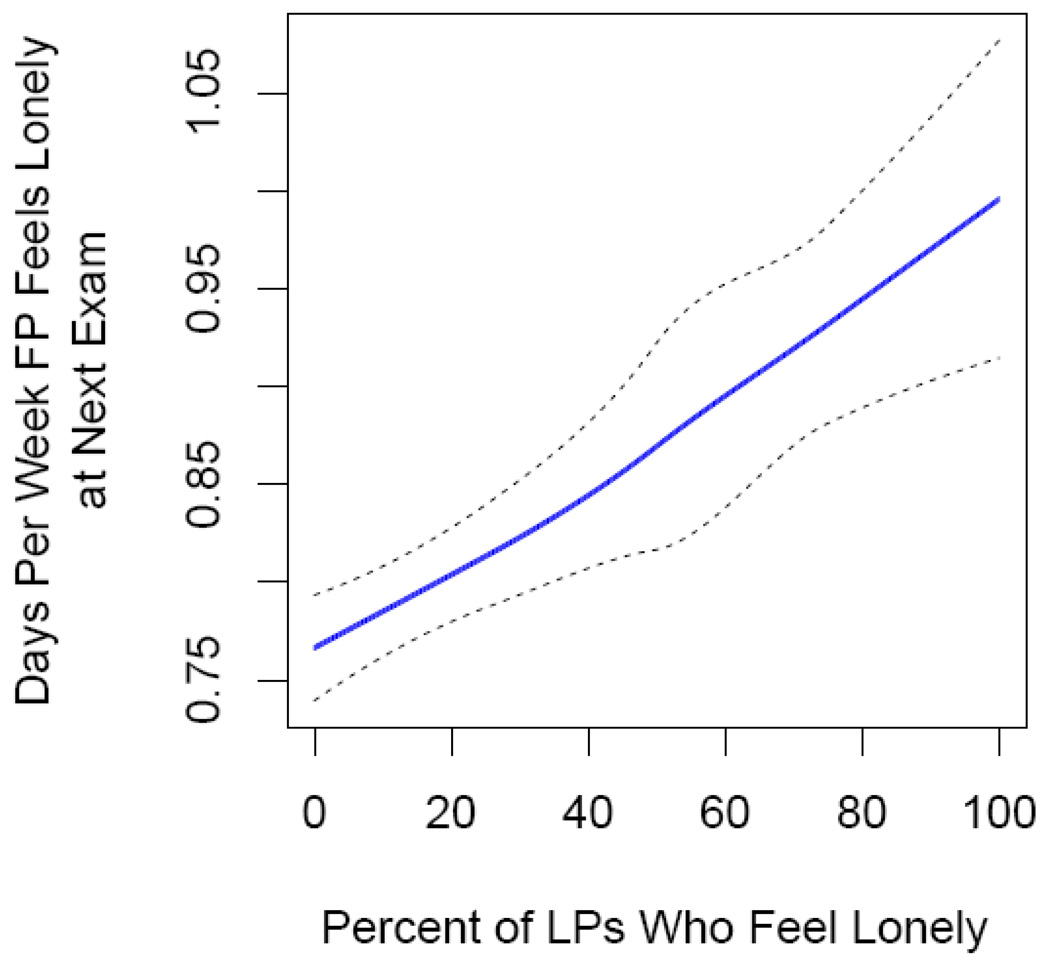
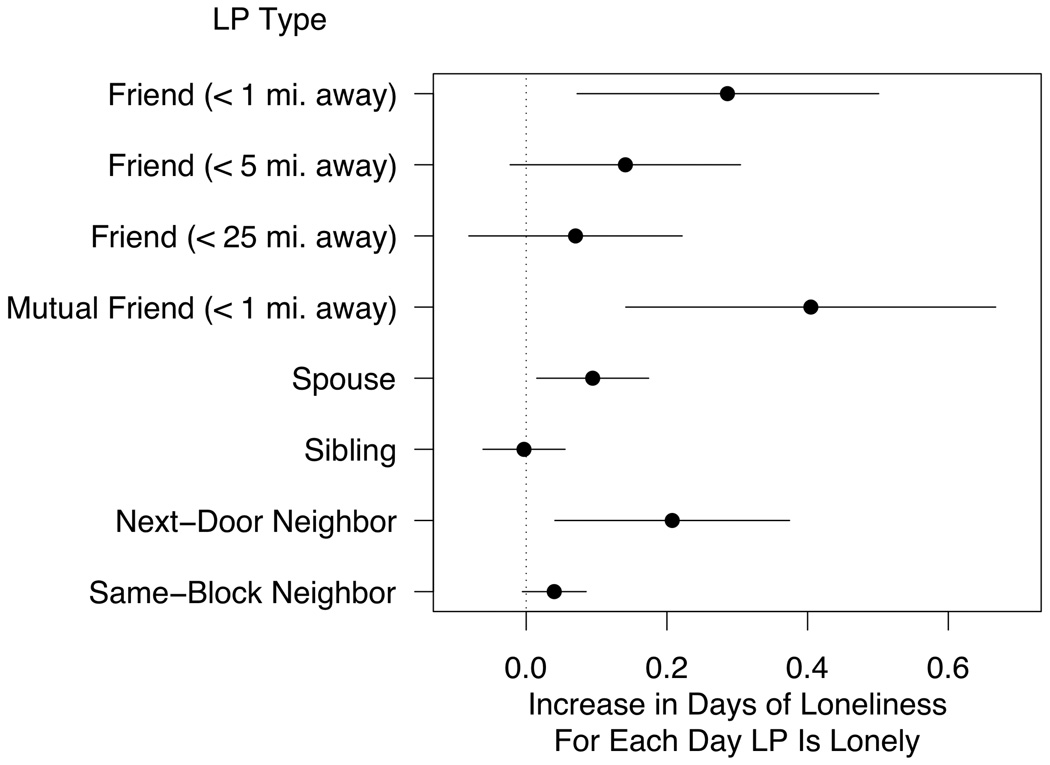
The discrepancy between an individual's loneliness and the number of connections in a social network is well documented, yet little is known about the placement of loneliness within, or the spread of loneliness through, social networks. The authors use network linkage data from the population-based Framingham Heart Study to trace the topography of loneliness in people's social networks and the path through which loneliness spreads through these networks. Results indicated that loneliness occurs in clusters, extends up to 3 degrees of separation, is disproportionately represented at the periphery of social networks, and spreads through a contagious process. The spread of loneliness was found to be stronger than the spread of perceived social connections, stronger for friends than family members, and stronger for women than for men. The results advance understanding of the broad social forces that drive loneliness and suggest that efforts to reduce loneliness in society may benefit by aggressively targeting the people in the periphery to help repair their social networks and to create a protective barrier against loneliness that can keep the whole network from unraveling.


Figures

Figure 1
Figure 1. Loneliness Clusters in the Framingham Social Network
This graph shows the largest component of friends, spouses, and siblings at exam 7 (centered on the year 2000). There are 1,019 individuals shown. Each node represents a participant and its shape denotes gender (circles are female, squares are male). Lines between nodes indicate relationship (red for siblings, black for friends and spouses). Node color denotes the mean number of days the FP and all directly connected (distance 1) LPs felt lonely in the past week, with yellow being 0–1 days, green being 2 days, and blue being greater than 3 days or more. The graph suggests clustering in loneliness and a relationship between being peripheral and feeling lonely, both of which are confirmed by statistical models discussed in the main text.
Figure 2
Figure 2. Social Distance and Loneliness in the Framingham Social Network
This figure shows for each exam the percentage increase in the likelihood a given FP is lonely if a friend or family member at a certain social distance is lonely (where lonely is defined as feeling lonely more than once a week). The relationship is strongest between individuals who are directly connected, but it remains significantly greater than zero at social distances up to 3 degrees of separation, meaning that a person’s loneliness is associated with the loneliness of people up to 3 degrees removed from them in the network. Values are derived by comparing the conditional probability of being lonely in the observed network with an identical network (with topology and incidence of loneliness preserved) in which the same number of lonely participants are randomly distributed. LP social distance refers to closest social distance between the LP and FP (LP = distance 1, LP’s LP = distance 2, etc.). Error bars show 95% confidence intervals.
Figure 3
Figure 3. Lonely LPs in the Framingham Social Network
This plot shows that the number of days per week a person feels lonely in exams 6 and 7 is positively associated with the fraction of their friends and family in the previous exam who are lonely (those who say they are lonely more than one day a week). Blue line shows smoothed relationship based on bivariate LOESS regression, and dotted lines indicate 95% confidence intervals. The results show that people surrounded by other lonely people themselves are more likely to feel lonely in the future.
Figure 4
Figure 4. LP Type and Loneliness in the Framingham Social Network
This figure shows that friends, spouses, and neighbors significantly influence loneliness, but only if they live very close to the FP. Effects are estimated using generalized estimating equation (GEE) linear models of linear on several different sub-samples of the Framingham Social Network; see Table 5a and Table 5b.

References

    1. Adam EK, Hawkley LC, Kudielka BM, Cacioppo JT. Day-to-day dynamics of experience--cortisol associations in a population-based sample of older adults. Proceedings of the National Academy of Science USA. 2006;103(45):17058–17063. - PMC - PubMed
    1. Akerlind I, Hornquist JO. Loneliness and alcohol abuse: a review of evidences of an interplay. Soc Sci Med. 1992;34(4):405–414. - PubMed
    1. Andersson L. Loneliness research and interventions: a review of the literature. Aging & Mental Health. 1998;2(4):264–274.
    1. Bartels M, Cacioppo JT, Hudziak JJ, Boomsma DI. Genetic and environmental contributions to stability in loneliness throughout childhood. Am J Med Genet B Neuropsychiatr Genet. 2008;147(3):385–391. - PubMed
    1. Beck N. TIME-SERIES-CROSS-SECTION DATA: What Have We Learned in the Past Few Years? Annual Review of Political Science. 2001;4(1):271–293.

Publication types