. 2009 Dec;35(6):1670-86.
doi: 10.1037/a0015798.

Feature integration across space, time, and orientation

Affiliations

Feature integration across space, time, and orientation

Thomas U Otto et al. J Exp Psychol Hum Percept Perform. 2009 Dec.

Abstract

The perception of a visual target can be strongly influenced by flanking stimuli. In static displays, performance on the target improves when the distance to the flanking elements increases-presumably because feature pooling and integration vanishes with distance. Here, we studied feature integration with dynamic stimuli. We show that features of single elements presented within a continuous motion stream are integrated largely independent of spatial distance (and orientation). Hence, space-based models of feature integration cannot be extended to dynamic stimuli. We suggest that feature integration is guided by perceptual grouping operations that maintain the identity of perceptual objects over space and time.


Figures
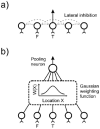
Figure 1
Figure 1
Mechanisms proposed to explain spatial interactions for static stimuli. Features are analyzed by a set of stimulus specific neurons. (a) Lateral inhibition. The central neuron is activated by the target stimulus (T). The neuron activated by a flanking stimulus (F) inhibits the neuron responding to T. The inhibitory interaction decreases as the distance between T and F is increased (as indicated by the dotted lines). (b) Pooling. Neurons are activated by T and F, respectively. A pooling neuron computes a weighted sum of the outputs of these sensory neurons. As with lateral inhibition, these excitatory interactions are distance-dependent; that is, the magnitude of the weights decreases with distance, typically following a Gaussian function.
Figure 2
Figure 2
(a) Sequential metacontrast. In the standard sequence, a central line (frame 0) was followed by four successive pairs of flanking lines (frames 1-4; frame numbers were not displayed in the actual displays). Actual stimuli were bluish white on a dark background. (b) A motion percept of two streams of lines diverging from the center is elicited. The central line itself is largely rendered invisible (Otto, Ogmen, & Herzog, 2006; for an animation, see supplementary material). In the experiments, we asked observers to attend only to one of the two streams (e.g., the right stream as highlighted by the grey ellipse). (c) We presented three basic offset conditions. In condition C, the central line contained a vernier-offset (“central-offset’) which was randomly offset either to the left or to the right in each trial. In addition, in the unattended stream, one of the flanking lines contained a vernier-offset (“flank-offset”, here in frame 3). The direction of the flank-offset was always opposite to the direction of the central-offset (i.e., when the central-offset was to the right, the flank-offset was to the left, and vice versa). Condition CF is the same as condition C but the flank-offset was presented in the attended stream. In condition F, the flank-offset was presented in the attended stream while the central line was aligned. In all conditions, we asked observers to indicate the direction of the vernier-offset perceived in the attended motion stream (the ellipses are used for graphical purpose and were not presented in the actual displays). (d) We recorded the percentages of responses in accordance with the central-offset. Because the direction of the flank-offset was opposite to the central-offset, this percentage is expected to be below 50% when responses are determined by the flank-offset (e.g., when 30% of the responses are in accordance with the central-offset, actually 70% of the responses are in accordance with the flank-offset). To provide an intuitive performance measure, we converted these percentages into dominance levels by subtracting 50%. With dominance levels, the sign indicates whether the central- (+) or the flank-offset (-) dominates the responses. Moreover, the absolute value reflects the strength of the corresponding dominance. A dominance level of 0% indicates that the two offsets contributed equally to the responses.
Figure 3
Figure 3
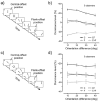
Flank-offset position. (a) We presented the standard sequence in the three basic offset conditions C, CF, and F (see also, Figure 2c). Block by block, we presented the flank-offset in frames 1, 2, or 3 (in this illustration, the flank-offset is shown in frame 3). (b) Dominance levels as a function of the flank-offset position. The sign of the dominance level indicates whether more responses were in accordance with the central- (+) or the flank-offset (-). The strength of the corresponding dominance is given by the absolute value (Figure 2d). In condition C, responses were dominated by the central-offset irrespective of the flank-offset position in the unattended stream. In condition F, responses were dominated by the flank-offset. This dominance was slightly stronger for flank-offsets presented later in the sequence. In condition CF, the dominance level was roughly between 0% and +10% indicating an integration of the two offsets. The actual dominance level was well predicted by the sum (C+F) of the dominance levels achieved in the conditions C and F. Means and SEM of 6 observers. SEM can be smaller than symbol size. (c, d) We repeated the experiment with 6 pairs of flanking lines. We presented flank-offsets in frames 2, 3, 4, and 5, respectively (no offset is shown in this illustration). Results are similar to the conditions with 4 pairs of flanking lines. Means and SEM of 6 observers.
Figure 4
Figure 4
Flank distance. We presented the standard sequence with the flank-offset in frame 3 (see Figure 2). We varied the distance between consecutive flanking lines. For flank distances of 100” and 300”, results are comparable to Experiment 1 with a flank distance of 200” (Figure 3b). However, for the flank distance of 500”, the dominance level in the condition with both the central- and the flank-offset in the attended stream differed from the predicted dominance level (CF vs. C+F). Hence, offset integration is not linear for this distance. Means and SEM of 6 observers.
Figure 5
Figure 5
Sequence length. (a) We presented a sequence with 4, 6, 8, or 10 pairs of flanking lines. The flank-offset was always presented in the penultimate frame (no offset is shown in this illustration). (b) The dominance level as a function of the number of flanking lines. In condition C, the dominance of the central-offset decreased the more flanking lines were presented. Similarly, in condition F, slightly fewer responses were determined by the flank-offset. In condition CF, the dominance level was slightly negative. The actual dominance level was well predicted by the sum (C+F) of the dominance levels achieved in the conditions C and F. Hence, linear integration occurs within a substantial spatio-temporal window of up to 0.5 deg and almost 400 ms. Mean and SEM of 5 observers.
Figure 6
Figure 6
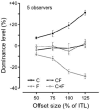
Dominance level as a function of offset sizes. In addition to the individual threshold level (ITL), we used offset sizes of 50%, 75%, and 125% of the ITL. In condition C, dominance of the central-offset increased for larger offset sizes. The same holds true for the dominance of the flank-offset in condition F. In condition CF, neither offset dominated. The dominance levels for condition CF are well predicted by the sum (C+F) of the dominance levels achieved in the conditions C and F. Means and SEM of 5 observers.
Figure 7
Figure 7
Contrast polarity. (a) We presented, block by block, different combinations of central and flanking line contrast polarities. For example, both central and flanking lines could be black (bb) or a black central line could be followed by white flanking lines (bw). No offsets are shown in this illustration. (b) Dominance levels for the different combinations of contrast polarity in the conditions C, CF, and F (see Figure 2c). In condition C, responses were dominated by the central-offset and, in condition F, by the flank-offset. In condition CF, dominance was around 0% indicating an integration of the two offsets. The dominance level for condition CF was well predicted by the sum (C+F) of the dominance levels achieved in the conditions C and F. (c) Sensitivity of central line detection for the different combinations of contrast polarity. Sensitivity is almost at chance level (d’=0) for sequences composed of lines with the same contrast polarity (bb and ww). Sensitivity is very high when the central and the flanking lines have opposite contrast polarities (bw and wb). (d) Attention and task. For the sequences with opposite contrast polarities, we asked observers to attend to the central line with opposite contrast polarity (Flash) and to indicate the offset of this line only. In condition C, only the central line was offset. In condition CF, in addition, both lines of frame 3 contained a flank-offset. Observers were not able to report the central-offset without taking the flanking lines into account as dominance level in conditions C and CF differed significantly. Moreover, dominance level seemed to be comparable to the analogous conditions when observers attended to one motion stream (Motion; data taken from b). Means and SEM of 6 observers.
Figure 8
Figure 8
Circular motion. (a) We presented sequences with 5 pairs of flanking lines. Flanking lines were perpendicular to the tangent of a (virtual) circular motion trajectory. Depending on the radius of the trajectory, the orientation difference between the central line and the last flanking line was 10, 20, 30, or 40 deg. The flank-offset was presented in frame 4 (no offsets are shown in this illustration). (b) Dominance level as a function of the orientation difference between the central and the last line. In condition C, the dominance of the central-offset deteriorated slightly when the orientation difference was increased. Similarly, in condition F, the dominance of the flank-offset deteriorated slightly. The integration of the central- and the flank-offset was linear as in the previous experiments (CF and C+F). Means and SEM of 5 observers. (c) The same experiment as in (a) except that the central line was oblique and the last line of the attended motion stream was vertical. (d) Results seem not to differ compared to (b). However, dominance levels in conditions C and F were largely unaffected by the orientation difference. Means and SEM of 5 observers.
Figure 9
Figure 9
Two line sequences. (a) We presented consecutively two lines that corresponded to the central line and the fourth, attended line of the sequence shown in Figure 8a. In condition C, observers attended to the first line with the central-offset. In condition F, observers attended to the second line with the flank-offset. In both conditions, the unattended line was not offset. In conditions CF-1 and CF-2, we presented both the central- and the flank-offset. The two conditions were physically the same, only the focus of attention differed. Observers attended either the first or the second line. (b) When the first line with the central-offset was attended, responses were dominated by the central-offset whether (CF-1) or not (C) the flank-offset was presented. When the second line with the flank-offset was attended, responses were dominated by the flank-offset (F and CF-2). However, this dominance seemed to be slightly reduced in condition CF-2. (c) We repeated the experiment with two lines that corresponded to the central line and the third, attended flanking line of the standard sequence (see Figure 2). (d) Results were similar to (a). Dominance of the central- and the flank-offset was slightly reduced in conditions CF-1 and CF-2 compared to conditions C and F, respectively. Means and SEM of 5 observers.

Similar articles

Cited by

References

    1. Appelle S. Perception and discrimination as a function of stimulus orientation: the “oblique effect” in man and animals. Psychological Bulletin. 1972;78(4):266–278. - PubMed
    1. Ariely D. Seeing sets: representation by statistical properties. Psychological Science. 2001;12(2):157–162. - PubMed
    1. Aydin M, Herzog MH, Ogmen H. Compression in slit viewing occurs at an object level. 2008 In revision. - PubMed
    1. Bach M. The Freiburg visual acuity test - automatic measurement of visual acuity. Optometry and Vision Science. 1996;73(1):49–53. - PubMed
    1. Badcock DR, Westheimer G. Spatial location and hyperacuity: flank position within the centre and surround zones. Spatial Vision. 1985a;1(1):3–11. - PubMed

Publication types