. 2009 Dec 7:10:585.
doi: 10.1186/1471-2164-10-585.

Genes and gene expression modules associated with caloric restriction and aging in the laboratory mouse

Affiliations

Genes and gene expression modules associated with caloric restriction and aging in the laboratory mouse

William R Swindell. BMC Genomics. .

Abstract

Background: Caloric restriction (CR) counters deleterious effects of aging and, for most mouse genotypes, increases mean and maximum lifespan. Previous analyses of microarray data have identified gene expression responses to CR that are shared among multiple mouse tissues, including the activation of anti-oxidant, tumor suppressor and anti-inflammatory pathways. These analyses have provided useful research directions, but have been restricted to a limited number of tissues, and have focused on individual genes, rather than whole-genome transcriptional networks. Furthermore, CR is thought to oppose age-associated gene expression patterns, but detailed statistical investigations of this hypothesis have not been carried out.

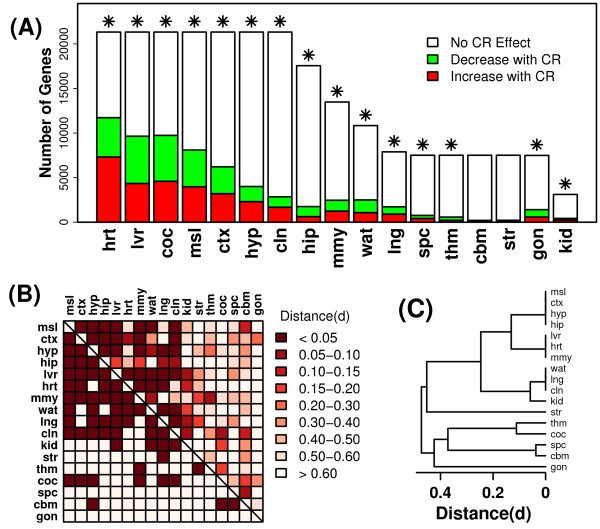
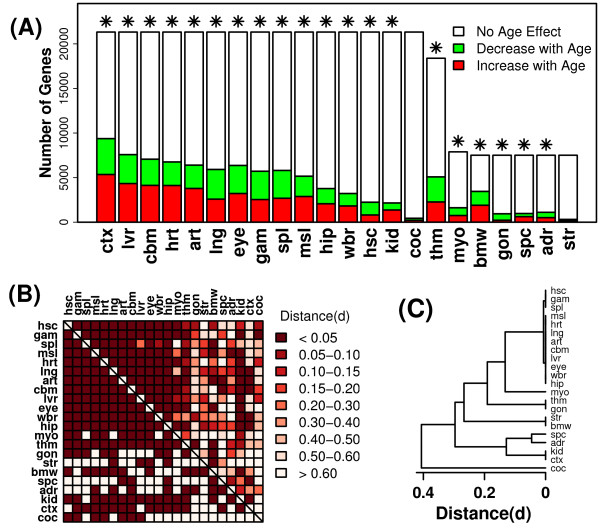
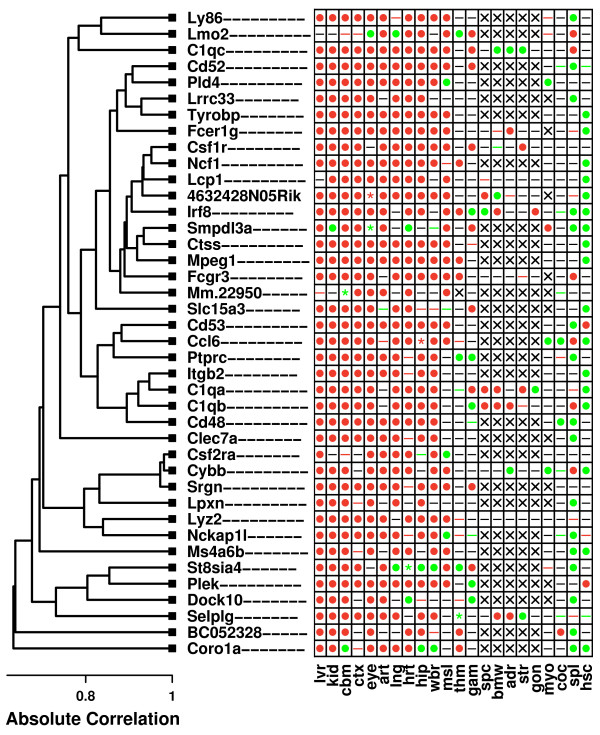
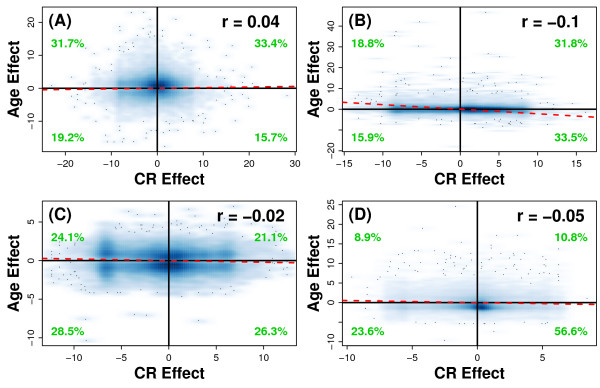
Results: Systemic effects of CR and aging were identified by examining transcriptional responses to CR in 17 mouse tissue types, as well as responses to aging in 22 tissues. CR broadly induced the expression of genes known to inhibit oxidative stress (e.g., Mt1, Mt2), inflammation (e.g., Nfkbia, Timp3) and tumorigenesis (e.g., Txnip, Zbtb16). Additionally, a network-based investigation revealed that CR regulates a large co-expression module containing genes associated with the metabolism and splicing of mRNA (e.g., Cpsf6, Sfpq, Sfrs18). The effects of aging were, to a considerable degree, similar among groups of co-expressed genes. Age-related gene expression patterns characteristic of most mouse tissues were identified, including up regulation of granulin (Grn) and secreted phosphoprotein 1 (Spp1). The transcriptional association between CR and aging varied at different levels of analysis. With respect to gene subsets associated with certain biological processes (e.g., immunity and inflammation), CR opposed age-associated expression patterns. However, among all genes, global transcriptional effects of CR were only weakly related to those of aging.

Conclusion: The study of aging, and of interventions thought to combat aging, has much to gain from data-driven and unbiased genomic investigations. Expression patterns identified in this analysis characterize a generalized response of mammalian cells to CR and/or aging. These patterns may be of importance in determining effects of CR on overall lifespan, or as factors that underlie age-related disease. The association between CR and aging warrants further study, but most evidence indicates that CR does not induce a genome-wide "reversal" of age-associated gene expression patterns.


Figures

Figure 1
Figure 1
Differential expression patterns associated with caloric restriction. Differential expression signatures associated with CR in each tissue were generated based upon integration of results from one or several datasets (see Table 1). (A) The total height of each bar indicates the number of genes for which the effects of CR had been evaluated in at least one experiment (maximum of 21,327 genes). Colored sub-bars indicate the number of genes significantly up regulated (red) or down regulated (green) by CR within each tissue type (given a comparison-wise type I error rate of 0.05). Asterisk symbols (✴) indicate tissues for which a larger number of significant genes were identified than expected by chance. (B) The grid provides information on the pair-wise overlap between differential expression signatures associated with each tissue. The above-diagonal region is color-coded to reflect the distance between differential expression signatures (d). The value of d ranges from 0 to 1, where low values of d indicate that, between two signatures being compared, there exists an over-abundance of genes significantly regulated by CR in the same direction (see Methods). The region below the diagonal is coded in binary fashion, with dark squares indicating significant overlap between two differential expression signatures (P < 0.05) (see Methods). (C) An average linkage hierarchical cluster analysis was applied to differential expression signatures, where distance between signatures was based upon the measure d that is color-coded in the upper-diagonal region of the grid from part (B).
Figure 2
Figure 2
Common gene expression responses to CR in the laboratory mouse. Common gene expression responses to CR are ranked according to the number of tissue types in which genes were (A) significantly up regulated by CR or (B) significantly down regulated by CR. Additional File 5 provides a more comprehensive list of genes significantly regulated by CR across tissues, with genes ranked by p-values generated from Fisher's method. Genes shown in part (C) were not identified as common responses to CR, but have previously been associated with the mammalian CR response. Symbols shown within the grid reflect results of differential expression analyses for individual genes and tissues, given a comparison-wise type I error rate of 0.05 (i.e., no p-value adjustment for multiple testing of hypotheses). Filled circles indicate that a gene was significantly up regulated by CR (red circle) (Pu < 0.05) or significantly down regulated by CR (green circle) (Pd < 0.05) within a given tissue. The dash symbol is used to indicate cases in which the effects of CR are non-significant, although colored dash symbols indicate that expression is marginally increased by CR (red dash) (0.05 < Pu < 0.10), or marginally decreased by CR (green dash) (0.05 < Pd < 0.10). The asterisk symbol (✴) is used to designate instances where CR has significant effects, but there exists conflict among datasets. This may arise if at least two experiments exist, with at least one showing significant up regulation by CR (Pu < 0.05), and at least one demonstrating significant down regulation by CR (Pd < 0.05). Additionally, the asterisk is used when p-values, generated by combining results across experiments (Fisher's method), yield conflicting results in terms of whether a gene is up or down regulated (i.e., both Pu < 0.05 and Pd < 0.05). Asterisk symbols are colored red if there is stronger evidence that the gene is up regulated by CR (i.e., Pu < 0.05 and Pu < Pd), and are colored green if there is stronger evidence that the gene is down regulated by CR (i.e., Pd < 0.05 and Pd < Pu). The multiplication symbol (×) is used for cases in which no information was available regarding the effects of CR within a given tissue.
Figure 3
Figure 3
Gene expression module regulated by CR. The figure shows a 40-gene co-expression module that is regulated by CR across multiple tissue types. Symbols shown within the grid reflect results of differential expression analyses for individual genes and tissues, given a comparison-wise type I error rate of 0.05 (i.e., no p-value adjustment for multiple testing of hypotheses). These symbols have the same interpretation as those shown in Figure 2. The columns of the grid, corresponding to individual tissue types, have been ordered from those for which module genes are most strongly up regulated by CR, to those for which module genes are most strongly down regulated by CR. The dendrogram (left) reflects the co-expression patterns among the 40 genes belonging to this module, which are based upon the expression of genes across a set of 3,700 Affymetrix 430 2.0 oligonucleotide arrays (see Methods). The dendrogram was generated by average linkage hierarchical cluster analysis, with distance between genes based upon the absolute value of Pearson's correlation coefficient (i.e., distance = 1 - |r|). Other CR-regulated co-expression modules were identified in the analysis, and further detail on the most significant of these is provided in Additional File 6.
Figure 4
Figure 4
Differential expression patterns associated with aging. Differential expression signatures associated with aging in each tissue were generated based upon integration of results from one or several datasets (see Table 1). (A) The total height of each bar indicates the number of genes for which the effects of aging had been evaluated in at least one experiment (maximum of 21,327 genes). Colored sub-bars indicate the number of genes significantly up regulated (red) or down regulated (green) by aging within each tissue type (given a comparison-wise type I error rate of 0.05). Asterisk symbols (✴) indicate tissues for which a larger number of significant genes were identified than expected by chance. (B) The grid provides information on the pair-wise overlap between differential expression signatures associated with each tissue. The above-diagonal region is color-coded to reflect the distance between differential expression signatures (d). The value of d ranges from 0 to 1, where low values of d indicate that, between two signatures being compared, there exists an over-abundance of genes significantly regulated by aging in the same direction (see Methods). The region below the diagonal is coded in binary fashion, with dark squares indicating significant overlap between two differential expression signatures (P < 0.05) (see Methods). (C) An average linkage hierarchical cluster analysis was applied to differential expression signatures, where distance between signatures was based upon the measure d that is color-coded in the upper-diagonal region of the grid from part (B).
Figure 5
Figure 5
Common gene expression responses to aging in the laboratory mouse. Common gene expression responses to aging are ranked according to the number of tissue types in which genes were (A) significantly up regulated with age or (B) significantly down regulated with age. Genes shown in part (C) were not identified as common responses to aging, but have previously been associated with aging in mammals. Symbols shown within the grid have the same interpretation as those in Figure 2 (with p-values based upon a comparison-wise type I error rate of 0.05), except aging is the experimental factor (rather than CR). Additional File 10 provides a more comprehensive list of genes significantly regulated by aging across tissues, with genes ranked by p-values generated from Fisher's method.
Figure 6
Figure 6
Gene expression module regulated by aging. The figure shows a 40-gene co-expression module that is regulated by aging across multiple tissue types. Symbols shown within the grid reflect results of differential expression analyses for individual genes and tissues, given a comparison-wise type I error rate of 0.05 (i.e., no p-value adjustment for multiple testing of hypotheses). These symbols have the same interpretation as those shown in Figure 2. The columns of the grid, corresponding to individual tissue types, have been ordered from those for which module genes are most strongly up regulated by age, to those for which module genes are most strongly down regulated by age. The dendrogram (left) reflects the co-expression patterns among the 40 genes belonging to this module, which are based upon the expression of genes across a set of 3,700 Affymetrix 430 2.0 oligonucleotide arrays (see Methods). The dendrogram was generated by average linkage hierarchical cluster analysis, with distance between genes based upon the absolute value of Pearson's correlation coefficient (i.e., distance = 1 - |r|). Other age-regulated co-expression modules were identified in the analysis, and further detail on the most of these is provided in Additional File 11.
Figure 7
Figure 7
Relationship between caloric restriction and aging. The association between CR and aging was evaluated for genes most strongly increased CR across tissues (Figure 2A), genes most strongly decreased by CR (Figure 2B), genes most strongly increased by aging (Figure 5A), and genes most strongly decreased by aging (Figure 5B). The "CR effect" is positive for genes up regulated by CR across tissues and negative for genes down regulated by CR across tissues. Likewise, the "age effect" is positive for genes up regulated with age across tissues and negative for genes down regulated with age across tissues. The magnitude of the CR effect and age effect reflects the degree of statistical significance. In particular, the CR effect is equal to I * -log[min(Pu, Pd)], where Pu and Pd are p-values generated by one-sided hypothesis tests of up and down regulation by CR across tissues, while I is equal to 1 if Pu <Pd and is equal to -1 otherwise. Similarly, the age effect is equal to I * -log[min(Pu, Pd)], where Pu and Pd are p-values generated by one-sided hypothesis tests of up and down regulation by aging, while I is equal to 1 if Pu < Pd and is equal to -1 otherwise.
Figure 8
Figure 8
Relationship between caloric restriction and aging in liver, heart, muscle and the central nervous system. The association between CR and aging was evaluated for the (A) liver, (B) heart, (C) muscle and (D) central nervous system (hippocampus + cortex). The CR effect is positive for genes up regulated by CR and negative for genes down regulated by CR (see Figure 7 legend). Likewise, the age effect is positive for genes up regulated with age and negative for genes down regulated with age (see Figure 7 legend). The abundance of genes in relation to the CR and age effect is reflected by the color intensity, with deep blue colors corresponding to regions with the largest number of genes. The dashed red line is based upon a least-squares regression fit that quantifies the overall relationship between the CR and aging effects. In each panel, the estimated Pearson correlation is shown in the upper-right, and the percentage values (green font) indicate the fraction of genes that belong to each quadrant. The effects of CR and aging were computed in each organ system based upon p-values generated by combining results from at least 3 independent experiments. In liver, CR and aging effects are based upon 9 and 7 experiments, respectively. In heart, CR and aging effects are based upon 5 and 10 experiments, respectively. For muscle and central nervous system, CR and aging effects are each based upon 3 -6 experiments. For each organ, distinct sets of data were used to estimate the CR and aging effects, such that CR and aging effects are a priori independent.
Figure 9
Figure 9
Relationship between caloric restriction and aging in liver, heart, muscle and the central nervous system. Association between differential expression signatures. The association between CR and aging was evaluated for the (A) liver, (B) heart, (C) muscle and (D) central nervous system (hippocampus + cortex). For each tissue, a differential expression signature was constructed corresponding to the effects of CR, and another signature was constructed corresponding to the effects of aging. Both signatures were based upon 3 or more experiments (see Figure 8 legend). CR and aging signatures were cross-tabulated, to place component genes into 9 separate categories, depending upon whether genes were increased by CR and/or aging (+), decreased by CR and/or aging (-), or whether CR and/or aging had no significant effect on gene expression (o). For each category, bars represent the adjusted Pearson residual (see Methods) (94). The absolute value of this quantity reflects the degree to which gene counts differ from what is expected based upon a random association between the CR and aging differential expression signatures. Positive residuals indicate that more genes belong to that category than expected by chance, given a random association between the effects of CR and aging. Negative residuals indicate that fewer genes belong to that category than expected by chance, given a random association between the effects of CR and aging. The adjusted Pearson residuals follow a standard normal distribution, with residuals larger than 3 in absolute value suggestive of significant, non-random associations between the effects of CR and aging [94]. The bars outlined in red indicate a significantly large or small residual (P < 0.05).
Figure 10
Figure 10
Relationship between caloric restriction and aging in liver, heart, muscle and the central nervous system. Association between ordered gene lists. The association between the effects of CR and aging were evaluated in (A) liver, (B) heart, (C) muscle and (D) central nervous system (hippocampus + cortex). The association was evaluated following the approach of Lottaz et al. (2006) [25]. For each tissue type, four ordered lists of genes were generated (abbreviated as: CRu, CRD, AGEu, AGED). The CRu list contained the 2,500 genes most strongly up regulated by CR, ordered according to the significance of this effect (i.e., most-to-least significant). Likewise, the CRD list contained the 2,500 genes most strongly down regulated by CR, ordered according to the significance of this effect (i.e., most-to-least significant). Similarly, the AGEU list contained the 2,500 genes most strongly up regulated with age, and the AGED list contained the 2,500 genes most strongly down regulated with age (ordered from most-to-least significant). In each panel, blue lines indicate the degree of overlap between CR and AGE gene lists, with respect to gene ranks between 1 and 2,500. On the right side of each panel, solid blue lines represent the overlap between CRU and AGEU, while dotted blue lines represent the overlap between CRUand AGED. On the left side of each panel, solid blue lines represent the overlap between CRD and AGED, while dotted blue lines represent the overlap between CRD and AGEU. Red bands in each plot correspond to 95% confidence intervals for the degree of overlap expected by chance (based on the hypergeometric distribution) (25). Given an inverse association between CR and aging, it is expected that dotted blue lines would fall above the region shown in red, whereas the solid blue lines would fall within (or below) the region shown in red.
Figure 11
Figure 11
Relationship between caloric restriction and aging. Gene ontology biological process terms associated with genes up regulated by aging across all mouse tissues. A total of 2554 genes were identified as significantly increased by aging across the 22 mouse tissue types, based upon stringent significance criteria (Pu < 0.001 and up regulated by age in at least five mouse tissues). Among these genes, significantly over-represented gene ontology (GO) biological process terms were identified (P < 0.05; hypergeometric test). These significant GO terms are shown in the chart and have been clustered according to the number of ancestor terms shared between any two GO biological processes. For each term, a subset of n associated genes was identified, and among these n genes, the correlation (r) between the transcriptional effects of CR and aging was evaluated. Transcriptional effects of CR and aging across tissues were defined as explained in Figure 7. For terms displayed in red font, the transcriptional association between CR and aging was negative (r < 0) and significant (P < 0.05). For terms displayed in blue font, the transcriptional association between CR and aging effects was positive (r > 0) and significant (P < 0.05). For all other terms (black font), there was no significant relationship between transcriptional effects of CR and aging (P > 0.05).
Figure 12
Figure 12
Relationship between caloric restriction and aging. Gene ontology biological process terms associated with genes down regulated by aging across all mouse tissues. A total of 663 genes were identified as significantly down regulated by aging across the 22 mouse tissue types, based upon stringent significance criteria (Pd < 0.01 and down regulated by age in at least five mouse tissues). Among these genes, significantly over-represented gene ontology biological process terms were identified (P < 0.05; hypergeometric test), and these terms are displayed in the figure. The same analysis described in Figure 11 was applied to each term. Colors indicate whether, among genes associated with each term, there was a significant negative relationship between transcriptional effects of CR and aging (red font; r < 0; P < 0.05), a significant positive relationship (blue font; r > 0; P < 0.05), or no significant relationship (black font; P > 0.05).

References

    1. Masoro EJ. Overview of caloric restriction and ageing. Mech Age Dev. 2005;126:913–22. doi: 10.1016/j.mad.2005.03.012. - DOI - PubMed
    1. Weindruch R, Walford RL, Fligiel S, Guthrie D. The Retardation of Aging in Mice by Dietary Restriciton: Longevity, Cancer, Immunity and Lifetime Energy Intake. J Nutrition. 1986;116:641–54. - PubMed
    1. Smith JV, Heilbronn LK, Ravussin E. Energy restriction and aging. Curr Opin Clin Nutr Metab Care. 2004;7:615–22. doi: 10.1097/00075197-200411000-00005. - DOI - PubMed
    1. Heilbronn LK, Ravussin E. Calorie restriction and aging: review of the literature and implications for studies in humans. Am J Clin Nutr. 2003;78:361–9. - PubMed
    1. Lane MA, Roth GS, Ingram DK. Caloric restriction mimetics: a novel approach for biogerontology. Methods Mol Biol. 2007;371:143–9. full_text. - PubMed

Publication types