

Anti-Müllerian hormone and inhibin B variability during normal menstrual cycles
- PMID: 19969291
- PMCID: PMC2891288
- DOI: 10.1016/j.fertnstert.2009.07.1674
Anti-Müllerian hormone and inhibin B variability during normal menstrual cycles
Abstract
Objective: To describe anti-Müllerian hormone (AMH) variation across normal menstrual cycles.
Design: Cohort study.
Setting: Academic environment.
Patient(s): Twenty regularly menstruating women.
Intervention(s): Serum AMH and inhibin B assayed daily during one normal menstrual cycle.
Main outcome measure(s): Intracycle variability of AMH and inhibin B.
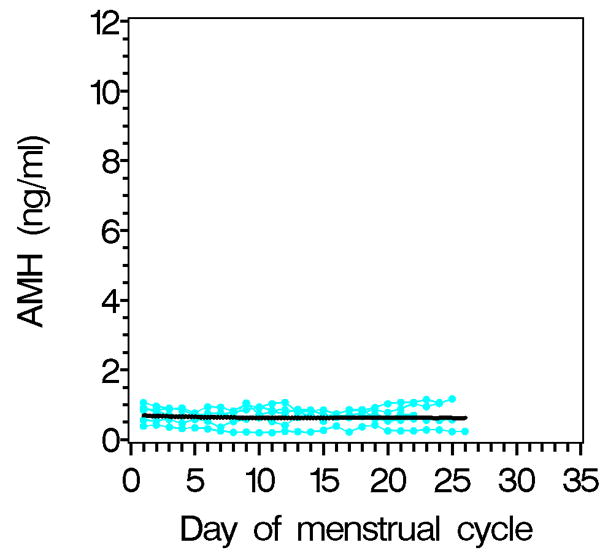
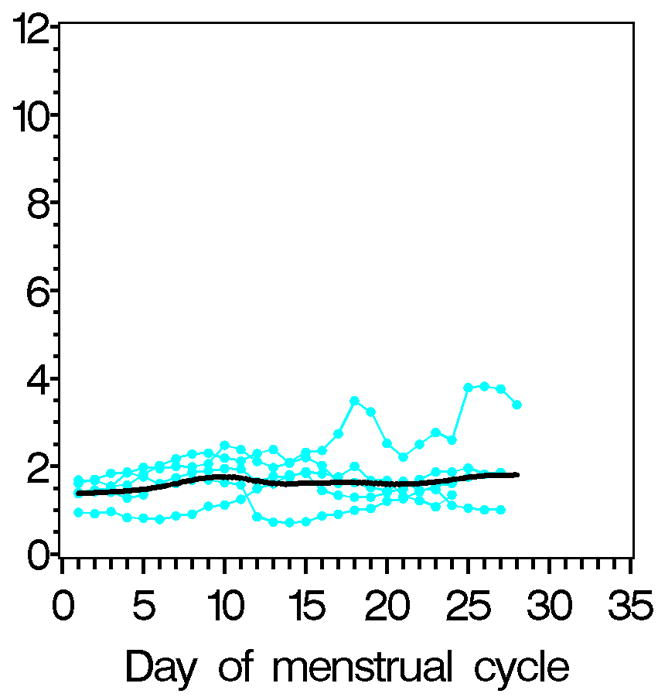
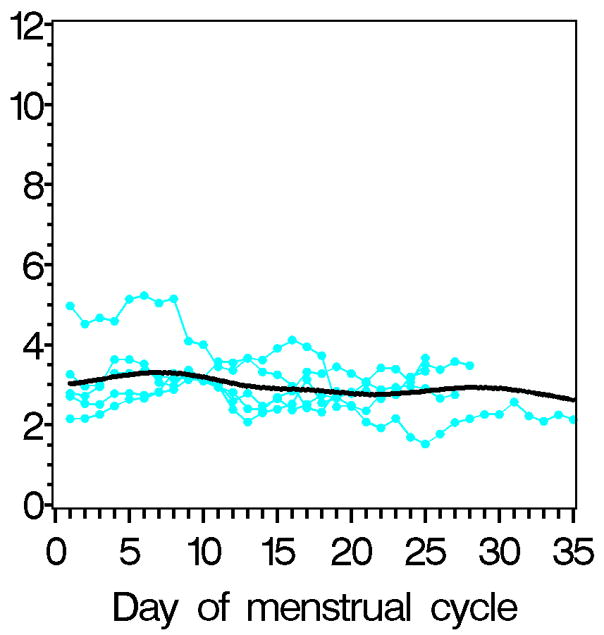
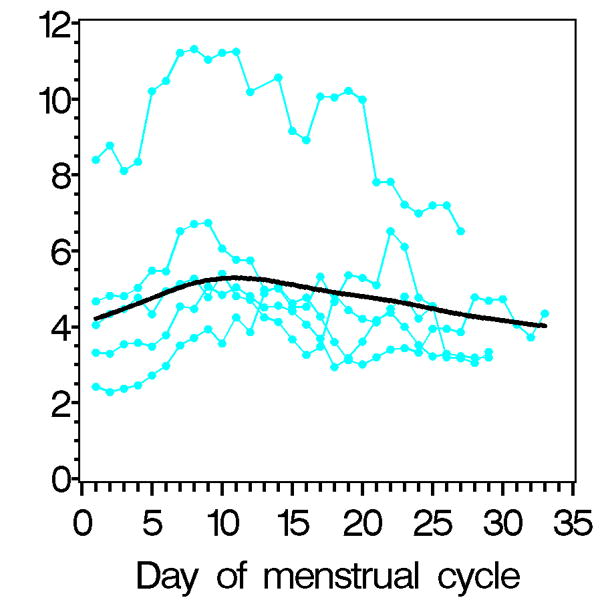
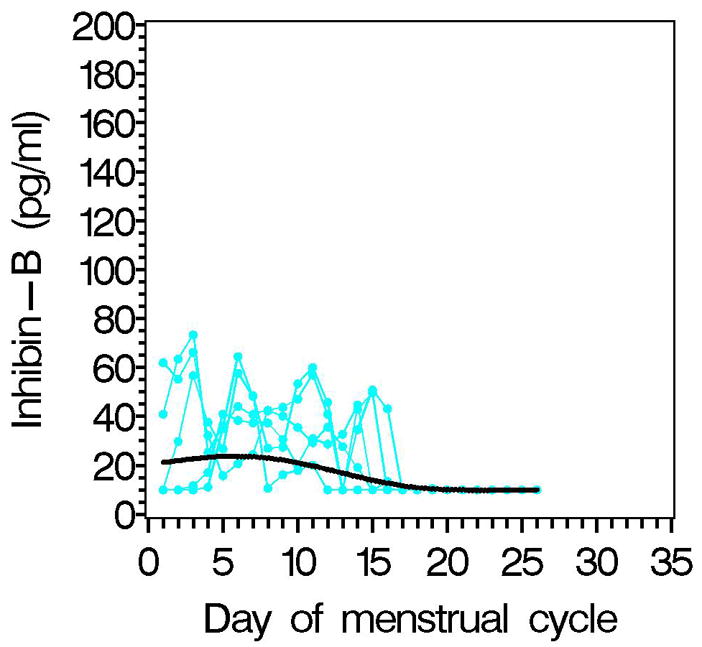
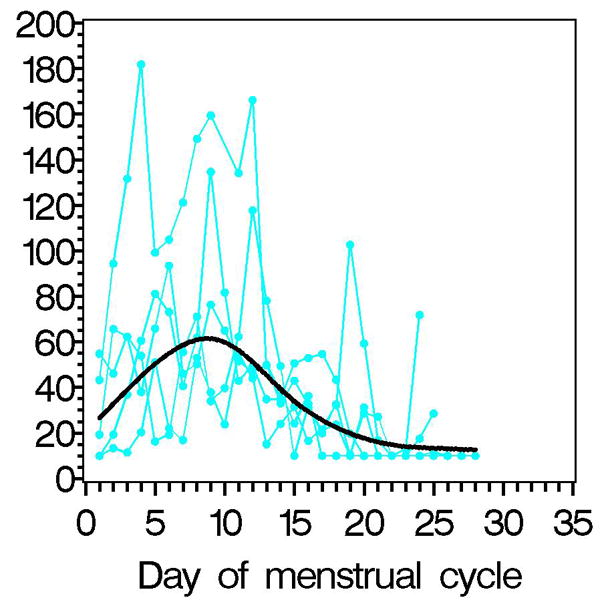
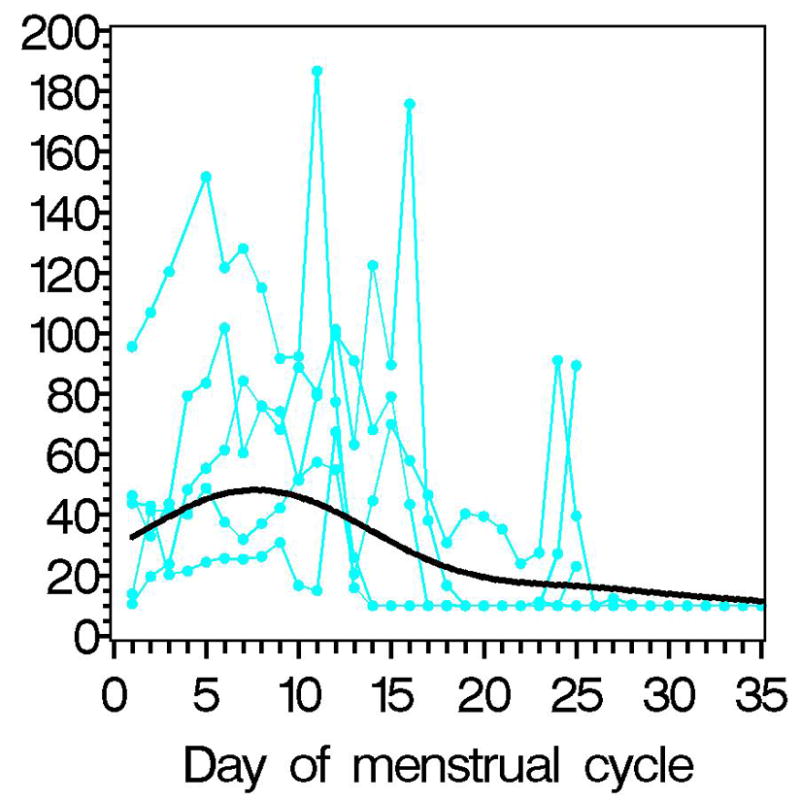
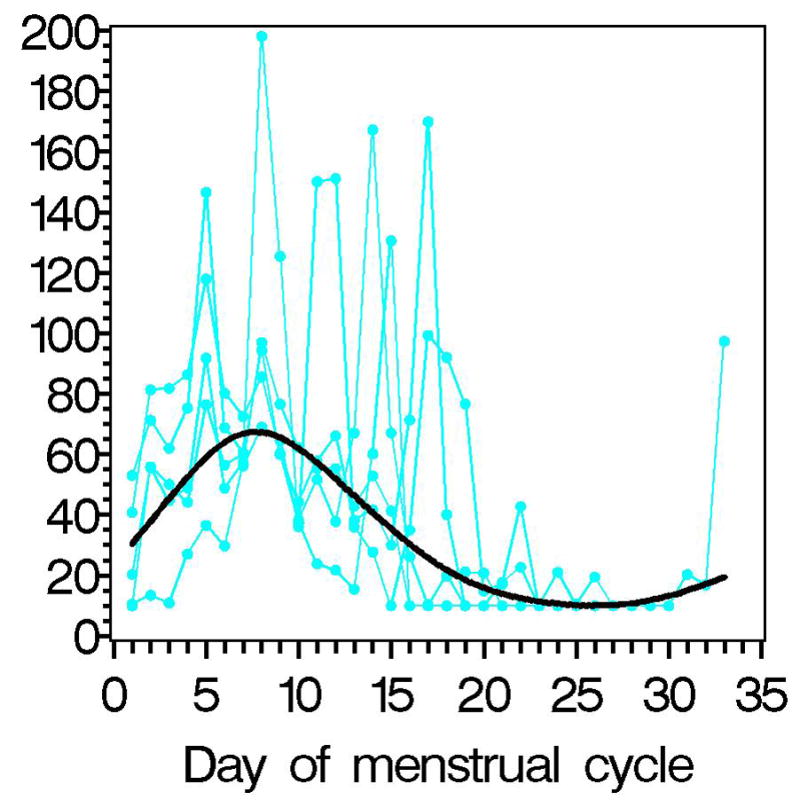
Result(s): Data were classified into quartiles of AMH area-under-the-curve (AUCs). Mean AMH AUC was 15.7 ng/mL for quartile 1 versus 43.5, 80.9 and 144.9 ng/mL for quartiles 2, 3, and 4. Mean AMH levels (ng/mL) were 0.67, 1.71, 3.02, and 5.33, respectively. There was no variation in quartile 1 AMH rate of change from stochastic modeling, but in quartiles 2 to 4, there were increased rates of change in days 2 to 7. Women in quartile 1 had the lowest mean inhibin B (24.2 pg/mL vs. 44.3, 43.2, and 42.2 pg/mL), and had shorter menstrual cycles (24.6 days) than women in quartiles 3 and 4 (28.2 and 28.4 days).
Conclusion(s): There were two menstrual cycle patterns of AMH. The "aging ovary" pattern included low AMH levels with little variation, lower inhibin B, and shorter cycle lengths. The "younger ovary" pattern included higher AMH levels with significant variation days 2 to 7, suggesting that for women with AMH>1 ng/mL, the interpretation of AMH levels is contingent upon the day of the menstrual cycle on which the specimen is obtained.
Copyright (c) 2010 American Society for Reproductive Medicine. Published by Elsevier Inc. All rights reserved.
Conflict of interest statement
Figures
Comment in
-
Variability in anti-Müllerian hormone levels: a comment on Sowers et al., Anti-Müllerian hormone and inhibin B variability during normal menstrual cycles.Fertil Steril. 2010 Sep;94(4):e59. doi: 10.1016/j.fertnstert.2010.06.016. Epub 2010 Jul 14. Fertil Steril. 2010. PMID: 20633878 No abstract available.
Similar articles
-
Updated assays for inhibin B and AMH provide evidence for regular episodic secretion of inhibin B but not AMH in the follicular phase of the normal menstrual cycle.Hum Reprod. 2014 Mar;29(3):592-600. doi: 10.1093/humrep/det447. Epub 2013 Dec 18. Hum Reprod. 2014. PMID: 24357435 Free PMC article.
-
Interactions between serum FSH, inhibin B and antral follicle count in the decline of serum AMH during the menstrual cycle in late reproductive age.Endocrinol Diabetes Metab. 2020 Aug 8;4(2):e00172. doi: 10.1002/edm2.172. eCollection 2021 Apr. Endocrinol Diabetes Metab. 2020. PMID: 33855196 Free PMC article.
-
Statistically significant changes of antimüllerian hormone and inhibin levels during the physiologic menstrual cycle in reproductive age women.Fertil Steril. 2008 Apr;89(4):927-33. doi: 10.1016/j.fertnstert.2007.04.054. Epub 2007 Jul 2. Fertil Steril. 2008. PMID: 17603052
-
Biological variability in serum anti-Müllerian hormone throughout the menstrual cycle in ovulatory and sporadic anovulatory cycles in eumenorrheic women.Hum Reprod. 2014 Aug;29(8):1764-72. doi: 10.1093/humrep/deu142. Epub 2014 Jun 12. Hum Reprod. 2014. PMID: 24925522 Free PMC article.
-
Serum anti-Müllerian hormone and inhibin B concentrations are not useful predictors of ovarian response during ovulation induction treatment with recombinant follicle-stimulating hormone in women with polycystic ovary syndrome.Fertil Steril. 2011 Aug;96(2):459-63. doi: 10.1016/j.fertnstert.2011.05.084. Epub 2011 Jun 29. Fertil Steril. 2011. PMID: 21719005
Cited by
-
Association Between AMH Levels and Fertility/Reproductive Outcomes Among Women Undergoing IVF: A Retrospective Study.J Reprod Infertil. 2022 Jan-Mar;23(1):54-60. doi: 10.18502/jri.v23i1.8453. J Reprod Infertil. 2022. PMID: 36045886 Free PMC article.
-
Antimullerian Hormone and Impending Menopause in Late Reproductive Age: The Study of Women's Health Across the Nation.J Clin Endocrinol Metab. 2020 Apr 1;105(4):e1862-71. doi: 10.1210/clinem/dgz283. J Clin Endocrinol Metab. 2020. PMID: 31965189 Free PMC article.
-
Updated assays for inhibin B and AMH provide evidence for regular episodic secretion of inhibin B but not AMH in the follicular phase of the normal menstrual cycle.Hum Reprod. 2014 Mar;29(3):592-600. doi: 10.1093/humrep/det447. Epub 2013 Dec 18. Hum Reprod. 2014. PMID: 24357435 Free PMC article.
-
Interindividual variation in ovarian reserve after gonadotoxic treatment in female childhood cancer survivors - a genome-wide association study: results from PanCareLIFE.Fertil Steril. 2024 Sep;122(3):514-524. doi: 10.1016/j.fertnstert.2024.05.002. Epub 2024 May 9. Fertil Steril. 2024. PMID: 38729340
-
Clinical Application of AMH Measurement in Assisted Reproduction.Front Endocrinol (Lausanne). 2020 Dec 9;11:606744. doi: 10.3389/fendo.2020.606744. eCollection 2020. Front Endocrinol (Lausanne). 2020. PMID: 33362720 Free PMC article. Review.
References
-
- Steiner AZ. Clinical implications of ovarian reserve testing. Obstet Gynecol Surv. 2009;64:120–8. - PubMed
-
- Kligman I, Rosenwaks Z. Differentiating clinical profiles: Predicting good responders, poor responders, and hyperresponders. Fertil Steril. 2001;76:1185–90. - PubMed
-
- Robertson DM, Hale GE, Fraser IS, Hughes CL, Burger HG. A proposed classification system for menstrual cycles in the menopausal transition based on changes in serum profiles. Menopause. 2008;15:1139–44. - PubMed
-
- Hale GE, Zhao X, Hughes CL, Burger HG, Robertson DM, Fraser IS. Endocrine features of menstrual cycles in middle and late reproductive age and the menopausal transition classified according to the staging of reproductive aging workshop (STRAW) staging system. J Clin Endocrinol Metab. 2007;92:3060–7. - PubMed
-
- Knight PG, Glister C. TGF-beta superfamily members and ovarian follicle development. Reproduction. 2006;132:191–206. - PubMed
Publication types
MeSH terms
Substances
Grants and funding
LinkOut - more resources
Full Text Sources
Other Literature Sources
Medical
