. 2010 Mar;38(5):1531-46.
doi: 10.1093/nar/gkp1060. Epub 2009 Dec 7.

Chain and conformation stability of solid-state DNA: implications for room temperature storage

Affiliations

Chain and conformation stability of solid-state DNA: implications for room temperature storage

Jacques Bonnet et al. Nucleic Acids Res. 2010 Mar.

Abstract

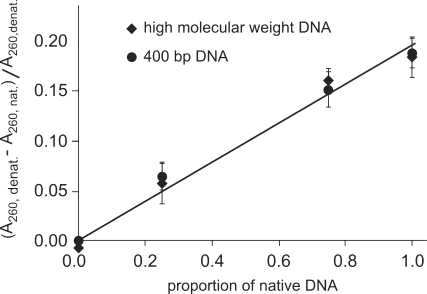
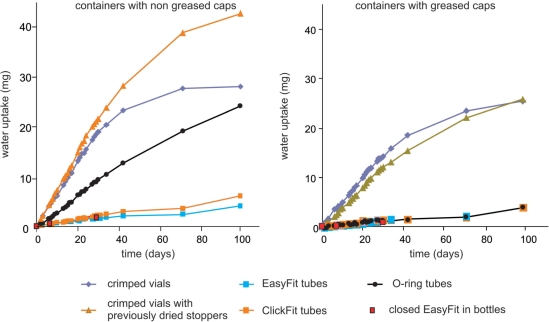
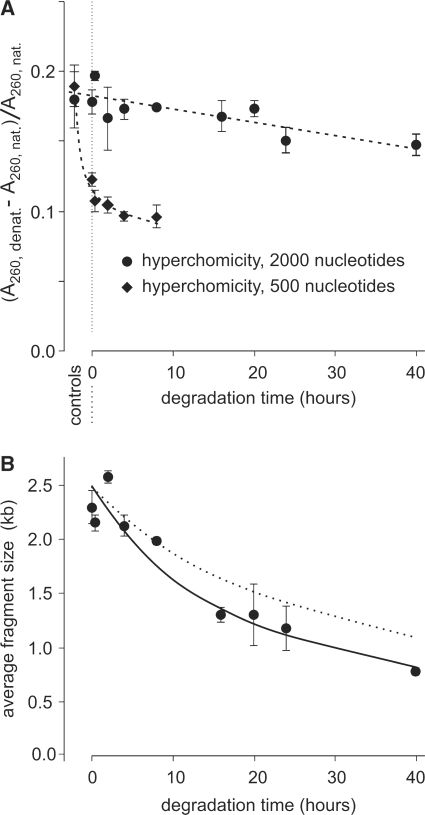
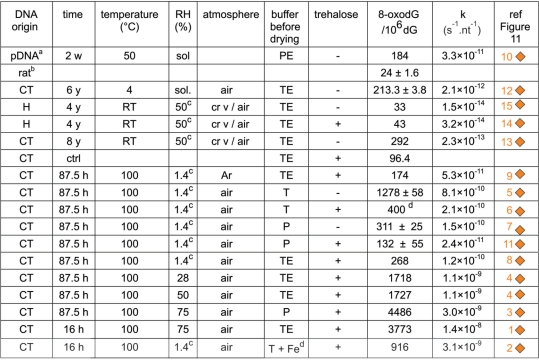
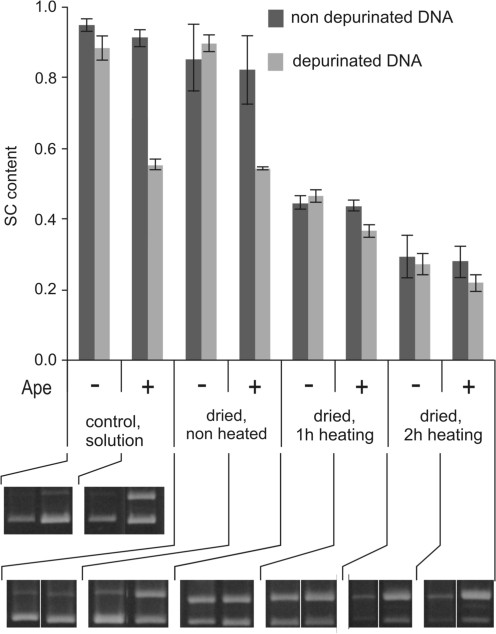
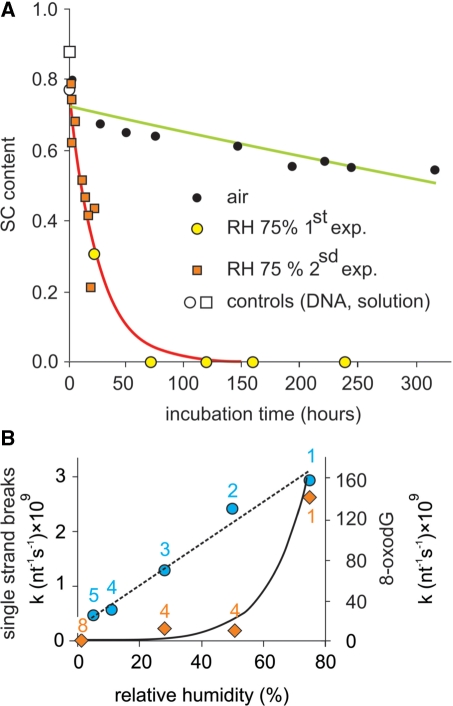
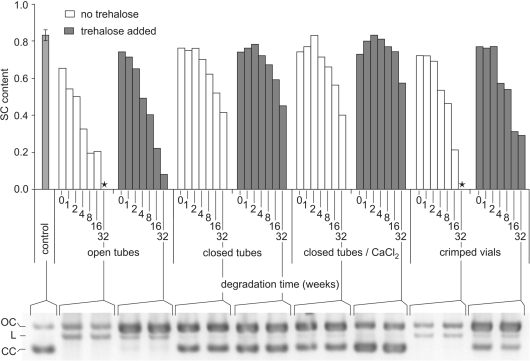
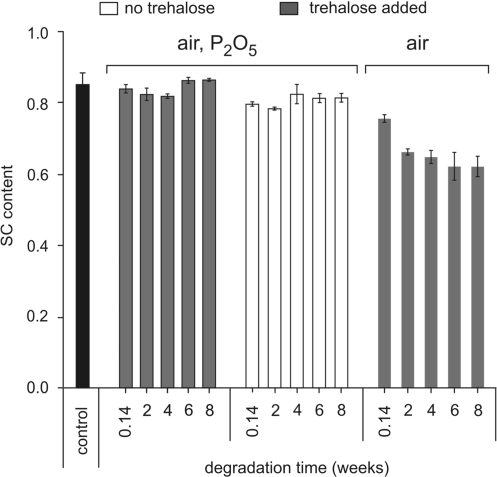
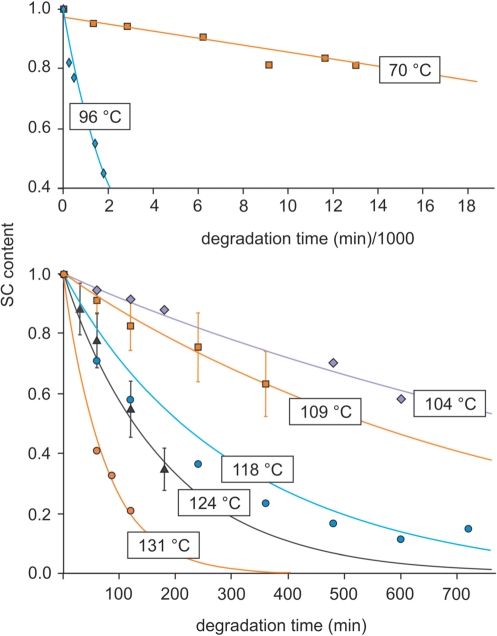
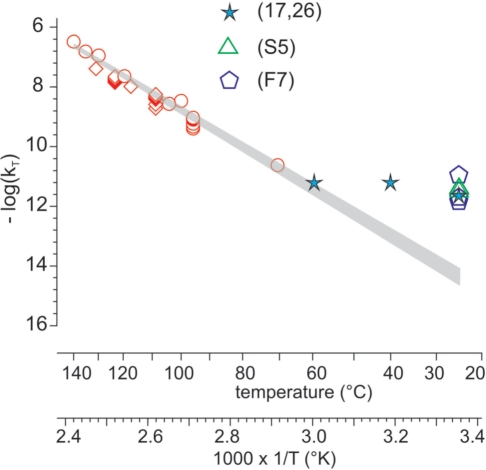
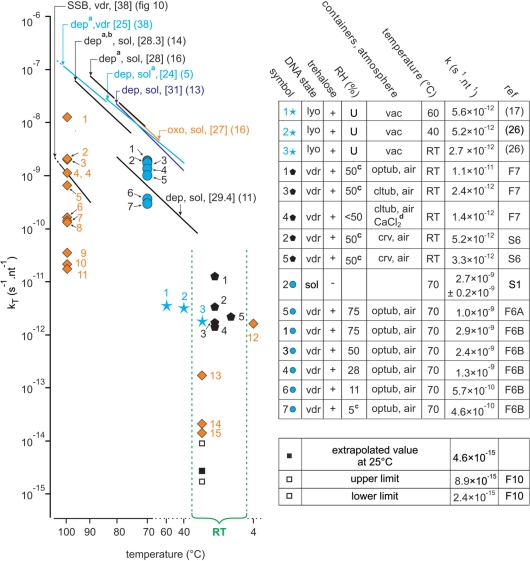
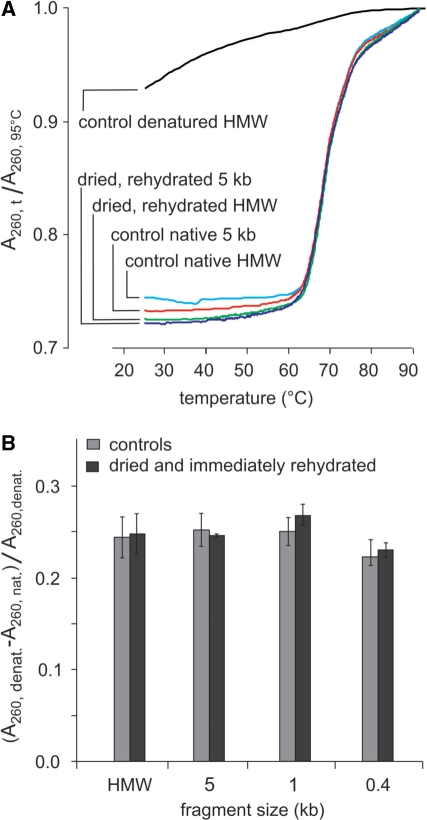
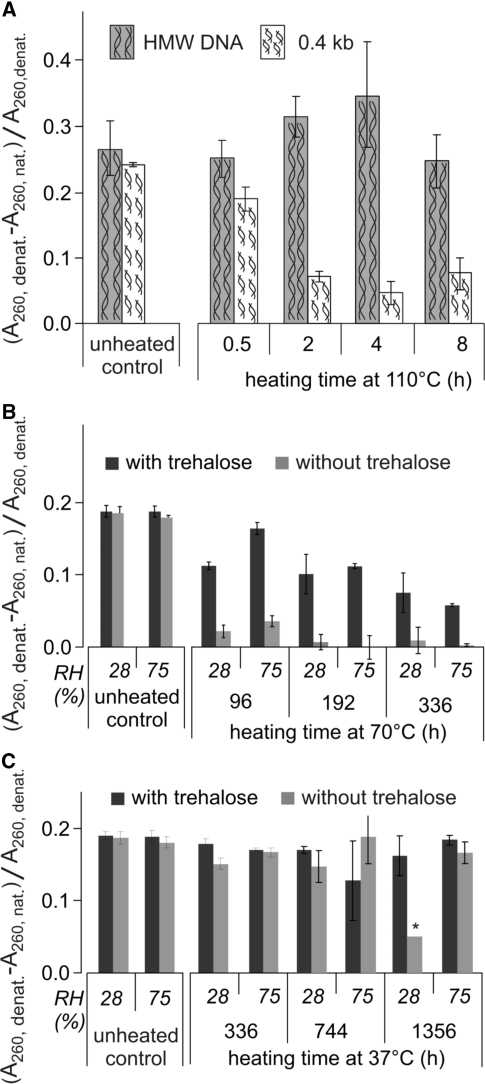
There is currently wide interest in room temperature storage of dehydrated DNA. However, there is insufficient knowledge about its chemical and structural stability. Here, we show that solid-state DNA degradation is greatly affected by atmospheric water and oxygen at room temperature. In these conditions DNA can even be lost by aggregation. These are major concerns since laboratory plastic ware is not airtight. Chain-breaking rates measured between 70 degrees C and 140 degrees C seemed to follow Arrhenius' law. Extrapolation to 25 degrees C gave a degradation rate of about 1-40 cuts/10(5) nucleotides/century. However, these figures are to be taken as very tentative since they depend on the validity of the extrapolation and the positive or negative effect of contaminants, buffers or additives. Regarding the secondary structure, denaturation experiments showed that DNA secondary structure could be preserved or fully restored upon rehydration, except possibly for small fragments. Indeed, below about 500 bp, DNA fragments underwent a very slow evolution (almost suppressed in the presence of trehalose) which could end in an irreversible denaturation. Thus, this work validates using room temperature for storage of DNA if completely protected from water and oxygen.


Figures

Figure 1.
Figure 1.
Hyperchromicity: linearity and sensitivity of the assay. Relative hyperchromicity (A260, denatured–A260, native)/A260, denatured) of mixtures of native and previously denatured DNA samples for high-molecular-weight and 400-bp DNA. The straight lines drawn through data points are y = 0.1958x (R2 = 0.981) and y = 0.953x(R2 = 0.9847) for high-molecular-weight and 400-bp DNA, respectively.
Figure 2.
Figure 2.
Control for air tightness of containers. The containers were filled with 1 g CaCl2 and regularly weighed. The lines serve as visual guides.
Figure 3.
Figure 3.
Control for cross-links. (A) Relative hyperchromicity (A260, denatured – A260, native)/A260, native) of DNA populations of 2000-nt and 500-nt average sizes of fragments after vacuum drying and heating kinetics at 110°C. Some error bars are smaller than the symbols. The lines serve as visual guides. (B) Average size of the large fragment population measured by denaturing gel electrophoresis. The continuous line was calculated by curve-fitting (giving a corresponding degradation rate of 5.5 × 10⁻⁹ s−1 nt−1). The dotted line represents the decrease in average fragment size calculated from plasmid degradation data (degradation rate: 3.5 × 10⁻⁹ s−1 nt−1 at this temperature). Some error bars are smaller than the symbols.
Figure 4.
Figure 4.
Level and rate of 8-oxodG formation as a function of incubation conditions. afrom (11); bfreshly extracted; capproximate value; d1 mM Fe3 + before drying; w: weeks; y: years; sol: in solution; c rv: crimped vials; P: phosphate buffer; PE: phosphate buffer + EDTA; T: Tris buffer; TE: Tris buffer + EDTA. The term nt−1 is used only to normalize the rates to one nucleotide to make the reaction rates independent of the size of the molecule.
Figure 5.
Figure 5.
Control for the absence of accumulation of abasic sites during DNA heating at low hydration. Quintuplicate depurinated or undepurinated plasmid DNA samples were vacuum-dried, then heated for 0, 1 or 2 h at 118°C, rehydrated and treated or not with Ape to cleave abasic sites in parallel to control samples kept in solution. SC content was determined as described in ‘Materials and methods’ section. On the gels, the upper and lower bands are the relaxed (OC) and supercoiled (SC) plasmid forms.
Figure 6.
Figure 6.
DNA degradation as a function of RH. (A) Plasmid DNA samples containing trehalose were incubated at 70°C in capped bottles containing an NaCl saturated solution (giving a RH of 75%). DNA samples were then rehydrated and the plasmid SC content was determined on Sybrgreen®-stained agarose gel after electrophoresis (‘Materials and methods’ section). The kinetic run in open air is redrawn from the 70°C experiment in Figure 10. (B) Closed circle: same experiment with additional RH values done with another plasmid (which consistently gave higher degradation rates than that used for the other experiments). The numbers refer to Figure 11. The dotted straight line serves as a visual guide. Closed diamonds: 8-oxodG rate formation at 100°C. The continuous line is an exponential fit through the circles. The 8-oxodG formation rates were determined from single measurements and should be viewed more as comparisons than absolute values. The numbers refer to Figure 4.
Figure 7.
Figure 7.
Plasmid relaxation at room temperature in various conditions. Plasmid DNA samples with or without trehalose were vacuum-dried in 0.2-ml glass inserts and stored in ambient air, in open or closed tubes, in closed tubes inside a box containing CaCl2 or in vials sealed (crimped) under dry argon. After 0–32 weeks, samples were rehydrated and their supercoiled content was determined on Sybrgreen®-stained agarose gel electrophoresis as described. Controls consisted in untreated plasmid samples kept in solution at 4°C. The histogram represents plasmid SC content. The gel performed after 32 weeks of storage is a representative example of the different analyses. On the gel, the upper, intermediate and lower bands are relaxed (open circle), linear and supercoiled forms, respectively. (*): sample with no SC left.
Figure 8.
Figure 8.
Plasmid relaxation at room temperature and low hydration. Triplicate plasmid DNA samples, with or without trehalose, were vacuum-dried in 0.2-ml glass inserts and placed in 1.5-ml tubes. The tubes were kept in open air or placed in bottles containing P2O5 with vacuum grease-coated caps, each bottle containing only one tube to avoid water uptake during removal of tubes. After incubation, samples were rehydrated, submitted to electrophoresis on agarose gel and their supercoiled content was determined after Sybrgreen® staining. The controls were plasmid samples kept in solution at 4°C or vacuum-dried and kept at –20°C and run on the different agarose gels.
Figure 9.
Figure 9.
Degradation kinetics at various temperatures. In this example (second series), plasmid DNA samples containing trehalose were vacuum-dried and sealed under controlled anhydrous and anoxic argon atmosphere (but due to leakage, these conditions were maintained only briefly, see text). The crimped vials were heated at temperatures ranging from 70°C to 140°C, DNA samples were rehydrated and the SC contents were determined on Sybrgreen®-stained agarose gel after electrophoresis (‘Materials and methods’ section). The first and second panels show respectively data for 70°C and 96°C and for temperatures ranging from 104°C to 131°C.
Figure 10.
Figure 10.
Determination of room temperature degradation rate of DNA at low hydration according to Arrhenius’ model. Degradation rates (kT) were determined at temperatures (T°K) ranging from 70°C to 140°C in different conditions. Rates measured at 70°C and room temperatures are taken from the experiments shown in Figures 6–8. These values are compared to some literature data as indicated. The log10(kT) values were plotted versus 1/T. The upper and lower limits of the shaded area represent the confidence intervals of log10(kT) calculated with the delta method, taking into account values ranging from 70°C to 140°C, as described in Supplementary Data S2 (statistical analysis). (17,26): data from references 17 and 26; (F7): data from Figure 7; (S5): data from Supplementary Data S5 (determination of genomic DNA degradation rate in air and at room temperature).
Figure 11.
Figure 11.
Compilation of quantitative kinetic data from literature and our work. (Left figure) The straight lines are the Arrhenius representations corresponding to depurination (dep), single-strand breaks (SSB) and 8-oxodG (oxo) formation obtained from our work or from the literature. Some of them have been truncated. The corresponding Ea (kcal mol−1) are indicated in brackets. The reactions were conducted on samples which were vacuum-dried (vdr) or in solution (sol) DNA. acorrected to pH 7.4 according to (13); bcorrected for strandness according to (13); capproximate values; F6, F7 and F10: respectively Figures 6, 7 and 10; dCaCl2 inside a CaCl2- containing dessiccator (ineffective in providing a low RH atmosphere); diamonds: kinetic constants for 8-oxodG formation, numbers refers to Figure 4. Other symbols: single-strand breaking rates. (Right table) The term nt−1 is used to normalize the rates to one nucleotide to make the reaction rates independent of the size of the molecule. lyo: lyophilized; U: unknown; vac: sample kept under vacuum; vdr: vacuum-dried; crv: crimped vials; optub: open tubes; cltub: closed tubes; RT: room temperature; S1, S6: respectively Supplementary Data S1 and S6.
Figure 12.
Figure 12.
Hyperchromicity as a function of fragment size of dehydrated and immediately rehydrated DNA. (A) Melting analysis of vacuum-dried and rehydrated high-molecular-weight or 5-kb genomic DNA samples. Controls in solution are native or heat denatured DNA. HMW: high-molecular- weight DNA. (B) Relative hyperchromicity (A260, denatured–A260, native)/(A260, denatured) of DNA populations of decreasing fragment sizes before and after vacuum drying and immediate rehydration (measures done in triplicate).
Figure 13.
Figure 13.
Evolution of hyperchromicity as a function of size, presence of trehalose, RH and heating time. (A) evolution of hyperchromicity at 110°C in the absence of trehalose for high-molecular-weight DNA and 0.4-kb fragments. Controls were equilibrated for one night at the temperatures and in the atmospheres used in the experiments. All measures were done in triplicate. (B) Evolution at 70°C for 0.4-kb fragments in the presence or absence of trehalose and 28% RH and 75% RH. The controls were done as in (A). (C) Same as in (B), at 37°C, *average of only two measures.

References

    1. Lindahl T. Instability and decay of the primary structure of DNA. Nature. 1993;362:709–715. - PubMed
    1. Mitchell D, Willerslev E, Hansen A. Damage and repair of ancient DNA. Mutat. Res. 2005;571:265–276. - PubMed
    1. Pogocki D, Schoneich C. Chemical stability of nucleic acid-derived drugs. J. Pharm. Sci. 2000;89:443–456. - PubMed
    1. Pogozelski WK, Tullius TD. Oxidative strand scission of nucleic acids: routes initiated by hydrogen abstraction from the sugar moiety. Chem. Rev. 1998;98:1089–1108. - PubMed
    1. Vilenchik MM, Knudson AG., Jr Inverse radiation dose-rate effects on somatic and germ-line mutations and DNA damage rates. Proc. Natl Acad. Sci. USA. 2000;97:5381–5386. - PMC - PubMed

Publication types