. 2009 Nov;36(11):4911-9.
doi: 10.1118/1.3232004.

Projection space denoising with bilateral filtering and CT noise modeling for dose reduction in CT

Affiliations

Projection space denoising with bilateral filtering and CT noise modeling for dose reduction in CT

Armando Manduca et al. Med Phys. 2009 Nov.

Abstract

Purpose: To investigate a novel locally adaptive projection space denoising algorithm for low-dose CT data.

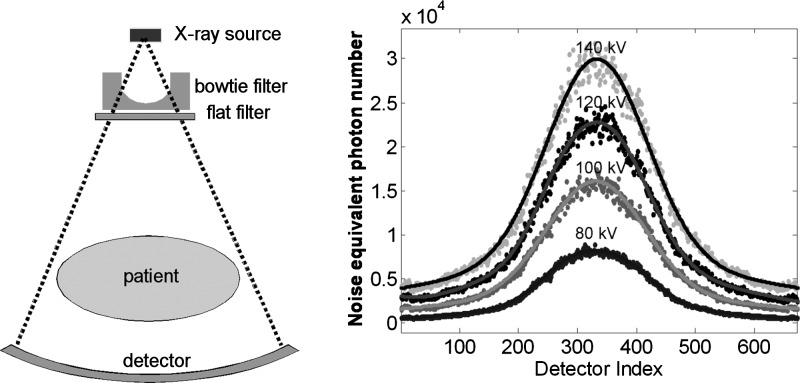
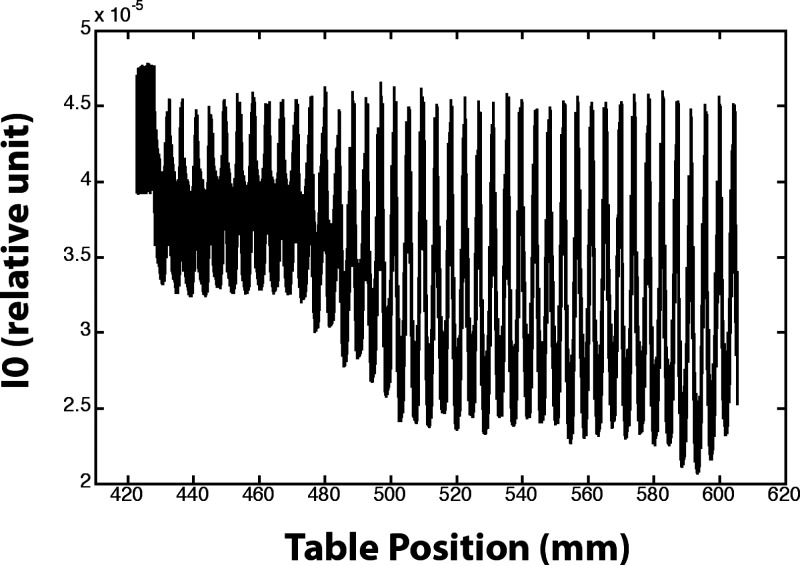
Methods: The denoising algorithm is based on bilateral filtering, which smooths values using a weighted average in a local neighborhood, with weights determined according to both spatial proximity and intensity similarity between the center pixel and the neighboring pixels. This filtering is locally adaptive and can preserve important edge information in the sinogram, thus maintaining high spatial resolution. A CT noise model that takes into account the bowtie filter and patient-specific automatic exposure control effects is also incorporated into the denoising process. The authors evaluated the noise-resolution properties of bilateral filtering incorporating such a CT noise model in phantom studies and preliminary patient studies with contrast-enhanced abdominal CT exams.

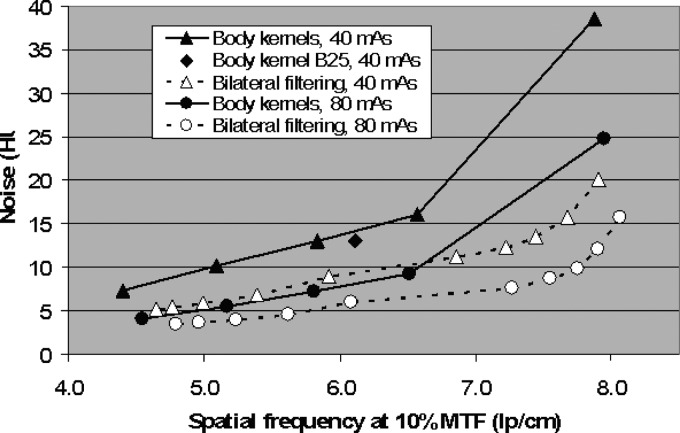
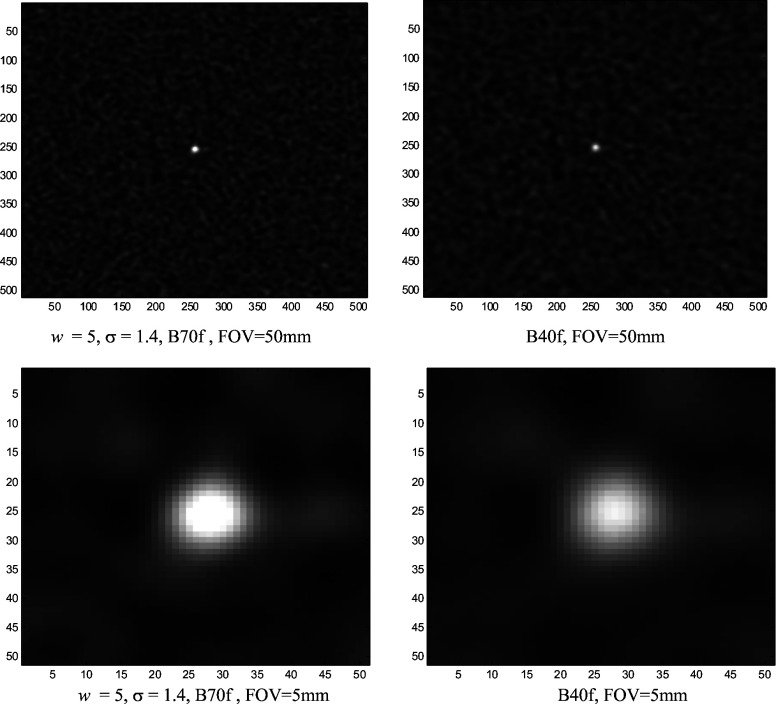
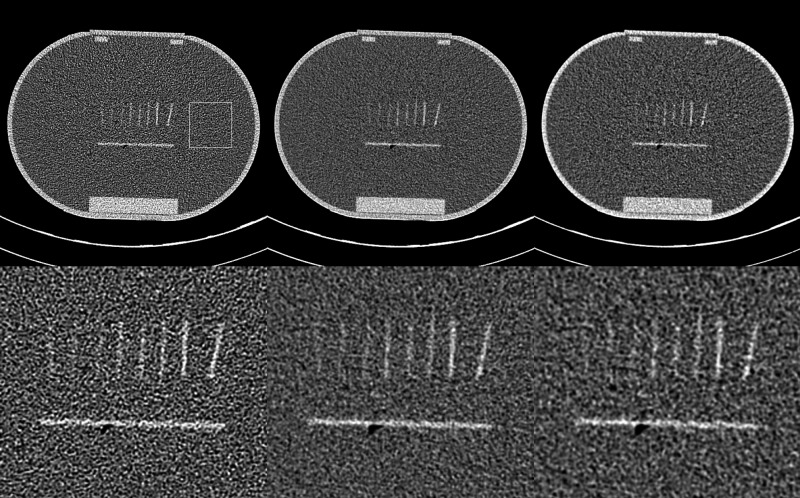
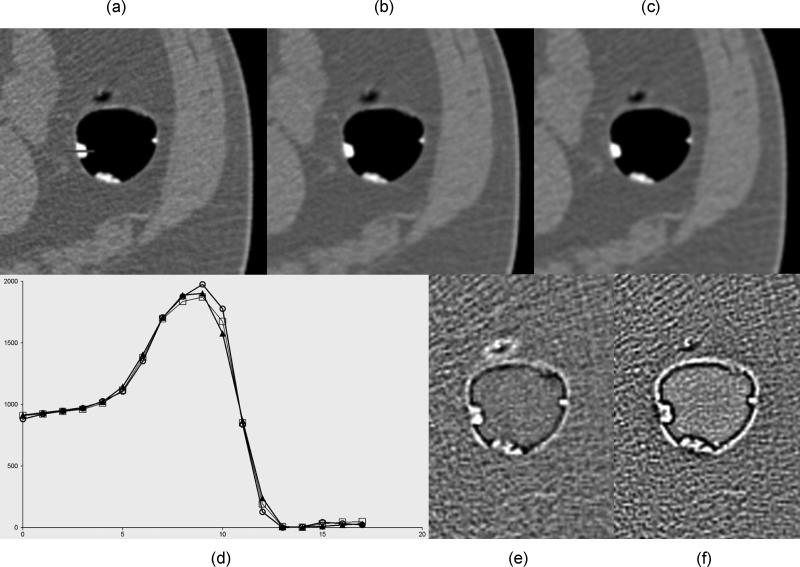
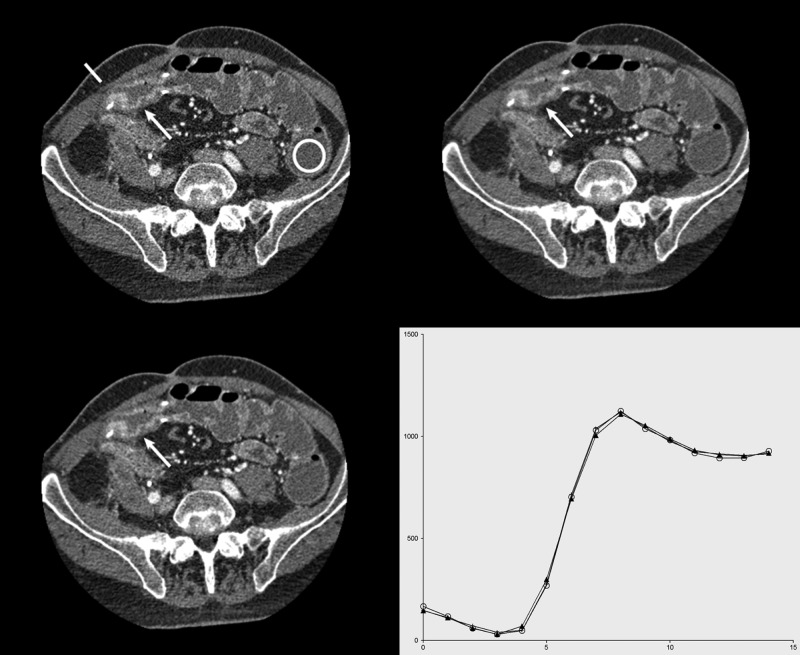
Results: On a thin wire phantom, the noise-resolution properties were significantly improved with the denoising algorithm compared to commercial reconstruction kernels. The noise-resolution properties on low-dose (40 mA s) data after denoising approximated those of conventional reconstructions at twice the dose level. A separate contrast plate phantom showed improved depiction of low-contrast plates with the denoising algorithm over conventional reconstructions when noise levels were matched. Similar improvement in noise-resolution properties was found on CT colonography data and on five abdominal low-energy (80 kV) CT exams. In each abdominal case, a board-certified subspecialized radiologist rated the denoised 80 kV images markedly superior in image quality compared to the commercially available reconstructions, and denoising improved the image quality to the point where the 80 kV images alone were considered to be of diagnostic quality.

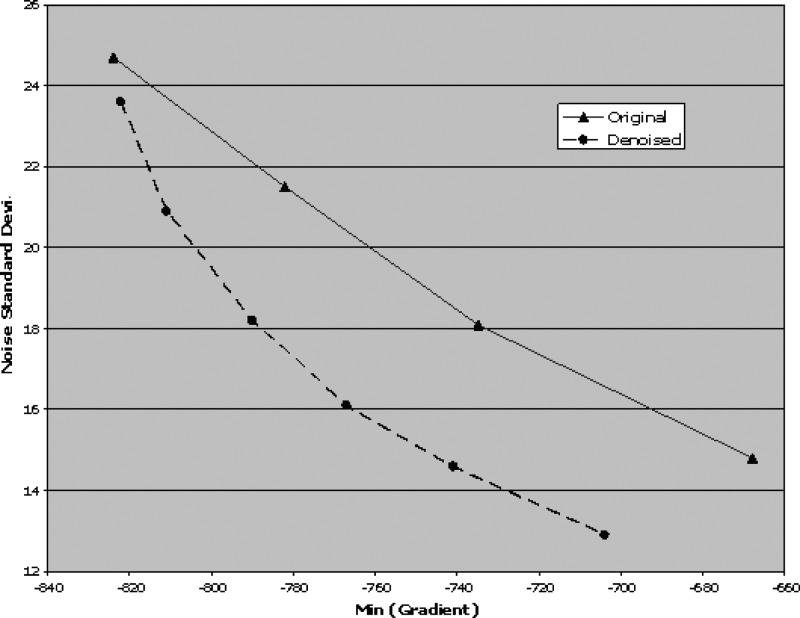
Conclusions: The results demonstrate that bilateral filtering incorporating a CT noise model can achieve a significantly better noise-resolution trade-off than a series of commercial reconstruction kernels. This improvement in noise-resolution properties can be used for improving image quality in CT and can be translated into substantial dose reduction.


Figures

FIG. 1.
FIG. 1.
Effect of x-ray beam bowtie filter. Left: Illustration of the bowtie filter in the x-ray beam to reduce the incident x-ray intensity in the peripheral region of the x-ray fan-beam. Right: An example of noise-equivalent number of x-ray quanta curves for 140, 120, 100, and 80 kV that can be used for characterizing the effect of the nonuniform photon intensity caused by the bowtie filter.
FIG. 2.
FIG. 2.
Effect of AEC. Displayed is an example of tube current modulation from an abdominal CT exam. The curve represents the reference signals (I0) on the detector as a function of table position. The reference signal is proportional to the tube current used for that table position and projection angle. The tube current oscillates as the table translates to adapt to the different attenuation levels of the patient along different projection angles.
FIG. 3.
FIG. 3.
Noise-resolution properties of bilateral filtering and body kernels. Noise is expressed as the standard deviation (HU) in a small ROI close to the thin wire. The spatial resolution was quantified as the spatial frequency at 10% of the maximum value on the MTF curve. The solid curve linking the solid triangles (▲) was obtained from the image scanned with 40 mA s and reconstructed with kernels of B10f, B20f, B30f, B40f, and B50f (from left to right). The solid diamond symbol (◆) was from the same scan and represents a special body kernel B25f. The dashed curve linking the open triangles (△) represents the noise-resolution results obtained from images after applying bilateral filtering to the 40 mA s scan data with ten different smoothing parameters. From left to right, the first five points were reconstructed with the B40f kernel, with w fixed at 5, and σ = 2.2, 1.8, 1.4, 1.0, 0.7, respectively; the second five points were reconstructed with a sharper B70f kernel, with w fixed at 5, and σ = 2.8, 2.2, 1.8, 1.4, and 1.0, respectively. The solid curve linking the solid circles (●) was obtained from the image scanned with 80 mA s and reconstructed with kernels of B10f, B20f, B30f, B40f, and B50f (from left to right). The dashed curve linking the open circles (○) represents the noise-resolution results obtained from images after applying bilateral filtering to the 80 mA s scan data with the same ten smoothing parameters as above. The noise-resolution results on the 40 mA s data after bilateral filtering approach or exceed the noise-resolution properties of the 80 mA s data, and filtering is effective on the 80 mA s data as well as on the 40 mA s data.
FIG. 4.
FIG. 4.
PSF of the wire images obtained with bilateral filtering (w=5, σ = 1.4) with the B70f kernel (left) and the B40f kernel without filtering (right) displayed in an large FOV of 50 mm (top row) and a small FOV of 5 mm (bottom row). The images have the same noise level at 16 HU, while the image with bilateral filtering has a much sharper appearance indicated by a sharper wire shape as well as a sharper noise texture.
FIG. 5.
FIG. 5.
The images for the stadium-shaped phantom after B45 reconstruction (top left), bilateral filtering followed by B45 reconstruction (top center), and B20 reconstruction (top right). The bottom row shows zoomed versions of the central region of the images. The standard deviations inside the ROI are 49.1, 31.9, and 32.9 HU, respectively. The lower contrast plates are, in our opinion, better visualized with the denoised image than with the B20f image.
FIG. 6.
FIG. 6.
Images of the colon containing labeled stool (a) with standard B40f reconstruction kernel and a line profile across stool-air interface, (b) with B40f reconstruction after projection space bilateral filtering with w=5, σ = 1.1, and (c) reconstructed with the unfiltered B10f kernel. (d) A profile along the line indicated in (a), showing the values (units of HU + 1024) for the B40f (○), B40f with denoising (◻), and B10f (▲). (e) Difference image between B40f and B40f with denoising reconstructions. (f) Difference image between B40f and B10f reconstructions. The difference images are at the same window and level settings.
FIG. 7.
FIG. 7.
Standard deviation of noise in air ROI vs largest negative gradient in profile in Fig. 6(a) calculated for different reconstruction kernels and for different levels of bilateral filtering followed by standard B40f reconstruction. The solid curve linking the solid triangles (▲) was calculated from images reconstructed with kernels of B40f, B30f, B20f, and B10f (from left to right; note that sharper edges are to the left). The dashed curve linking the circles (●) was calculated from images reconstructed with the B40f kernel after denoising with w=5 and σ = 0.3, 0.5, 0.7, 0.9, 1.1, and 1.5, respectively.
FIG. 8.
FIG. 8.
Contrast-enhanced low-energy images obtained from a dual-energy CT enterography exam. Top left: The image reconstructed from the 80 kV scan with kernel B40f. The line represents the profile location and the circle represents the ROI for noise measurements. Top right: Image after bilateral filtering and reconstruction (w=5, σ = 1, B40f). Radiologists preferred the visualization of the mural stratification in the neoterminal ileum (arrow) in the denoised image. Bottom left: Image with B20f reconstruction. The noise levels in the ROI denoted by the circle were 39.1, 25.6, and 25.9, respectively. Bottom right: Profiles across the line in the upper left showing the values for the B40f (○), B40f with denoising (+), and B20f (▲) reconstructions.

References

    1. Brenner D. J. and Hall E. J., “Computed tomography—an increasing source of radiation exposure,” N. Engl. J. Med. NEJMAG357, 2277–2284 (2007).10.1056/NEJMra072149 - DOI - PubMed
    1. Huda W. and Vance A., “Patient radiation doses from adult and pediatric CT,” AJR, Am. J. Roentgenol. AAJRDX188, 540–546 (2007).10.2214/AJR.06.0101 - DOI - PubMed
    1. Kak A. C. and Slaney M., Principles of Computed Tomographic Imaging (SIAM, Philadelphia, PA, 2001).
    1. Hsieh J., “Adaptive streak artifact reduction in computed tomography resulting from excessive x-ray photon noise,” Med. Phys. MPHYA625, 2139–2147 (1998).10.1118/1.598410 - DOI - PubMed
    1. Kachelriess M., Watzke O., and Kalendar W. A., “Generalized multi-dimensional adaptive filtering for conventional and spiral single-slice, multi-slice, and cone-beam CT,” Med. Phys. MPHYA628, 475–490 (2001).10.1118/1.1358303 - DOI - PubMed

Publication types

MeSH terms