

The mixability of angiographic contrast with arterial blood
- PMID: 19994517
- PMCID: PMC2773458
- DOI: 10.1118/1.3243079
The mixability of angiographic contrast with arterial blood
Abstract
Purpose: Angiographic contrast that is routinely injected into arteries is used not only to evaluate arterial geometry but also in many cases to assess perfusion. The authors conducted two experiments to examine the dispersion of angiographic contrast injected antegradely into an artery under conditions similar to those found in selective (carotid artery) or superselective (circle of Willis) angiography in order to determine the distance from the catheter tip at which the contrast can be considered fully mixed with the blood. A third experiment investigated whether the contrast once mixed with blood will separate from the mixture under the gravitational field due to a density mismatch.
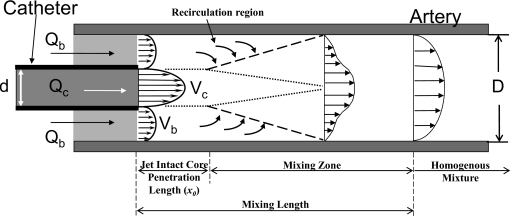
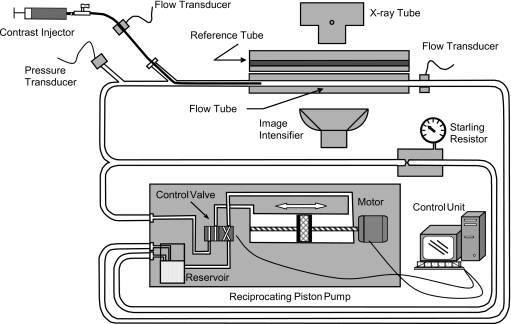
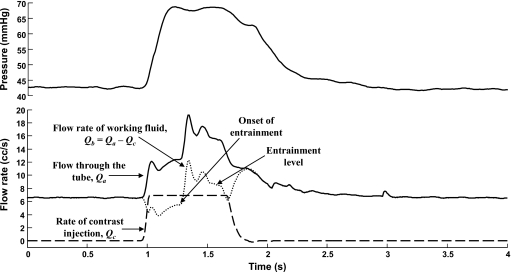
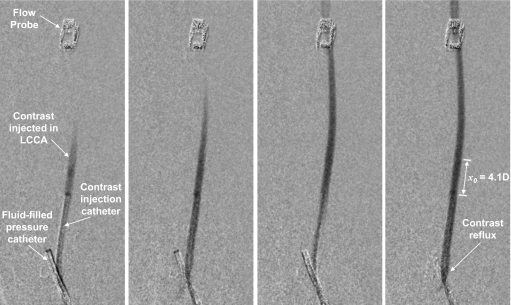
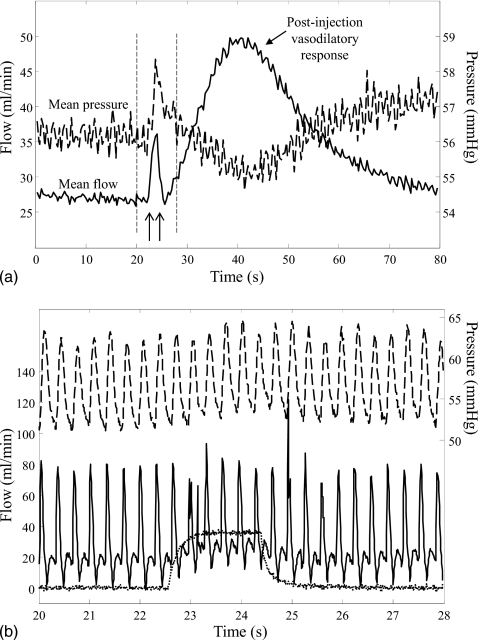
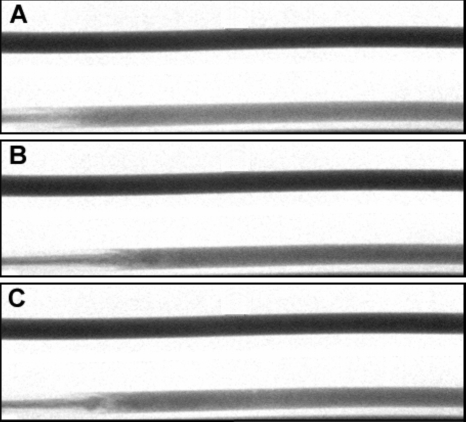
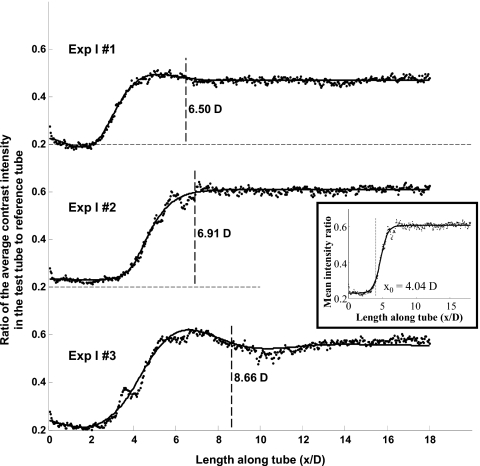
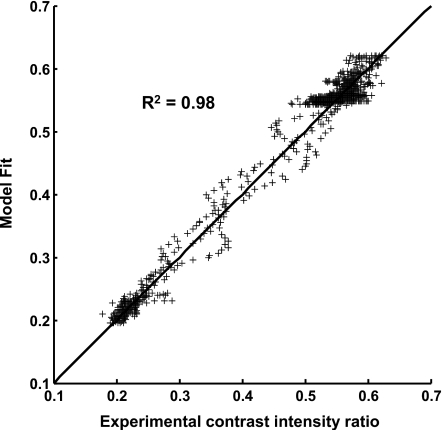
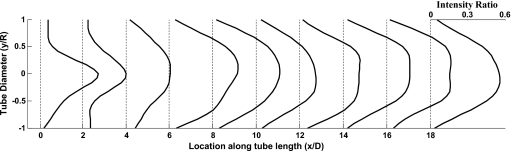
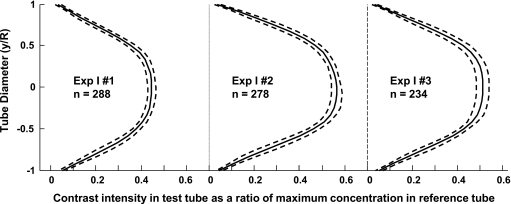
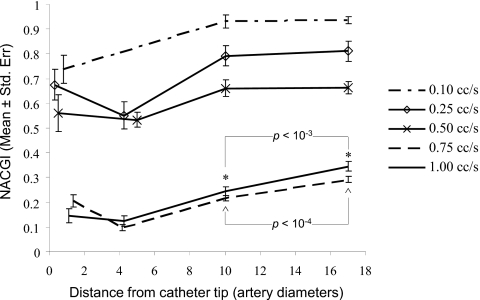
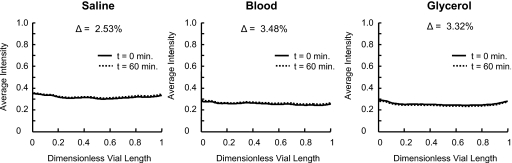
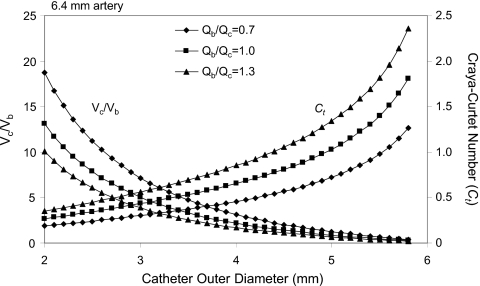
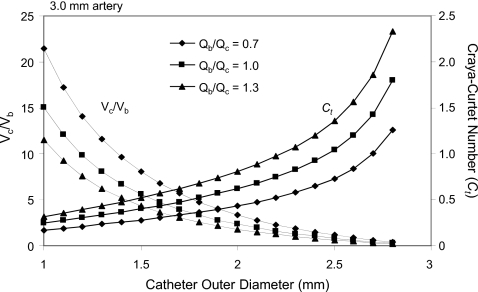
Methods: Experiment I--Under high-speed angiographic acquisition, a bolus of contrast was injected through a catheter along the flow direction of a blood analog fluid flowing through a straight, long, cylindrical tube. The variation in grayscale intensity along the length of the tube was acquired and modeled as the step response to a second-order system. The distance from the catheter tip at which the contrast mixes with the working fluid, the mixing length, was determined as the length along the tube after which the step response settles to within 3% of the steady state value. Experiment II--A bolus of angiographic contrast was injected at rates varying from 0.1 to 1 cc/s through three different catheter sizes in the left common carotid artery of three rabbits. The average cross-sectional grayscale intensity over one cardiac cycle was calculated at four locations along the artery: Immediately distal to the catheter tip, at location of maximum grayscale intensity, and at 10 and 20 arterial diameters from the catheter tip. The status of mixing within 10 arterial diameters was assessed by differences between the grayscale value at this location and that at the maximum and 20 arterial diameter location. Experiment III--Angiographic contrast was premixed by agitation in three separate vials containing normal saline, canine blood, and glycerol/distilled-water mixture. The vials were then stationed vertically and angiographic images obtained every 5 min for 1 h. The average intensity of contrast along the vertical length of each vial was obtained for every time point to record any changes in the distribution of contrast over time.
Results: The first experiment shows that angiographic contrast completely mixes with steady flowing blood analog fluid within about eight tube diameters of the injection site. The second experiment shows that contrast completely mixes with blood within ten arterial diameters under appropriate injection parameters. The third experiment shows that angiographic contrast does not separate from, or settle out of, contrast-carrying fluid mixtures for a period of 1 h.
Conclusions: The results demonstrate that under typical injection conditions in the clinical setting, contrast issuing from the catheter completely mixes with the blood within ten artery diameters downstream of the catheter tip. Once mixed, it does not separate from the blood due to gravity.
Figures
Similar articles
-
Dispersive Transport of Angiographic Contrast During Antegrade Arterial Injection.Cardiovasc Eng Technol. 2012 Jun 1;3(2):171-178. doi: 10.1007/s13239-012-0090-x. Epub 2012 Apr 13. Cardiovasc Eng Technol. 2012. PMID: 23139732 Free PMC article.
-
Pressure and Flow Rate Changes During Contrast Injections in Cerebral Angiography: Correlation to Reflux Length.Cardiovasc Eng Technol. 2018 Jun;9(2):226-239. doi: 10.1007/s13239-018-0344-3. Epub 2018 Mar 1. Cardiovasc Eng Technol. 2018. PMID: 29497965
-
Impact of intra-arterial injection parameters on arterial, capillary, and venous time-concentration curves in a canine model.AJNR Am J Neuroradiol. 2009 Aug;30(7):1337-41. doi: 10.3174/ajnr.A1586. Epub 2009 May 20. AJNR Am J Neuroradiol. 2009. PMID: 19461063 Free PMC article.
-
[Diagnosis of renal artery stenosis with magnetic resonance angiography and stenosis quantification].J Mal Vasc. 2000 Dec;25(5):312-320. J Mal Vasc. 2000. PMID: 11148391 Review. French.
-
[A new approach for studying the retinal and choroidal circulation].Nippon Ganka Gakkai Zasshi. 2004 Dec;108(12):836-61; discussion 862. Nippon Ganka Gakkai Zasshi. 2004. PMID: 15656089 Review. Japanese.
Cited by
-
Reliability and Accuracy of Peri-Interventional Stenosis Grading in Peripheral Artery Disease Using Color-Coded Quantitative Fluoroscopy: A Phantom Study Comparing a Clinical and Scientific Postprocessing Software.Biomed Res Int. 2018 Jul 24;2018:6180138. doi: 10.1155/2018/6180138. eCollection 2018. Biomed Res Int. 2018. PMID: 30140698 Free PMC article.
-
An in vitro study of pressure increases during contrast injections in diagnostic cerebral angiography.Interv Neuroradiol. 2021 Oct;27(5):695-702. doi: 10.1177/1591019921996099. Epub 2021 Feb 25. Interv Neuroradiol. 2021. PMID: 33631993 Free PMC article.
-
Dispersive Transport of Angiographic Contrast During Antegrade Arterial Injection.Cardiovasc Eng Technol. 2012 Jun 1;3(2):171-178. doi: 10.1007/s13239-012-0090-x. Epub 2012 Apr 13. Cardiovasc Eng Technol. 2012. PMID: 23139732 Free PMC article.
-
Angiographic assessment of the efficacy of flow diverter treatment for cerebral aneurysms.Interv Neuroradiol. 2019 Dec;25(6):655-663. doi: 10.1177/1591019919860829. Epub 2019 Jul 11. Interv Neuroradiol. 2019. PMID: 31296064 Free PMC article.
-
In silico intravascular optical coherence tomography (IVOCT) for quality assured imaging with reduced intervention.Sci Rep. 2024 Jun 5;14(1):12930. doi: 10.1038/s41598-024-61177-1. Sci Rep. 2024. PMID: 38839774 Free PMC article.
References
-
- Mabon R. F. et al., “Fluid dynamics in cerebral angiography,” Radiology RADLAX 128(3), 669–676 (1978). - PubMed
-
- Becker H. A., “Confined jet mixing for nonseparating conditions — Discussion,” J. Basic Eng. JBAEAI 93(3), 347 (1971).
-
- Barchilon M. and Curtet R., “Some details of the structure of an axisymmetric confined jet with back-flow,” J. Basic Eng. JBAEAI 86(4), 777–787 (1964).
Publication types
MeSH terms
Substances
Grants and funding
LinkOut - more resources
Full Text Sources
Other Literature Sources
Medical
