

Association of immunosuppressant-induced protein changes in the rat kidney with changes in urine metabolite patterns: a proteo-metabonomic study
- PMID: 19994912
- PMCID: PMC3955702
- DOI: 10.1021/pr900761m
Association of immunosuppressant-induced protein changes in the rat kidney with changes in urine metabolite patterns: a proteo-metabonomic study
Abstract
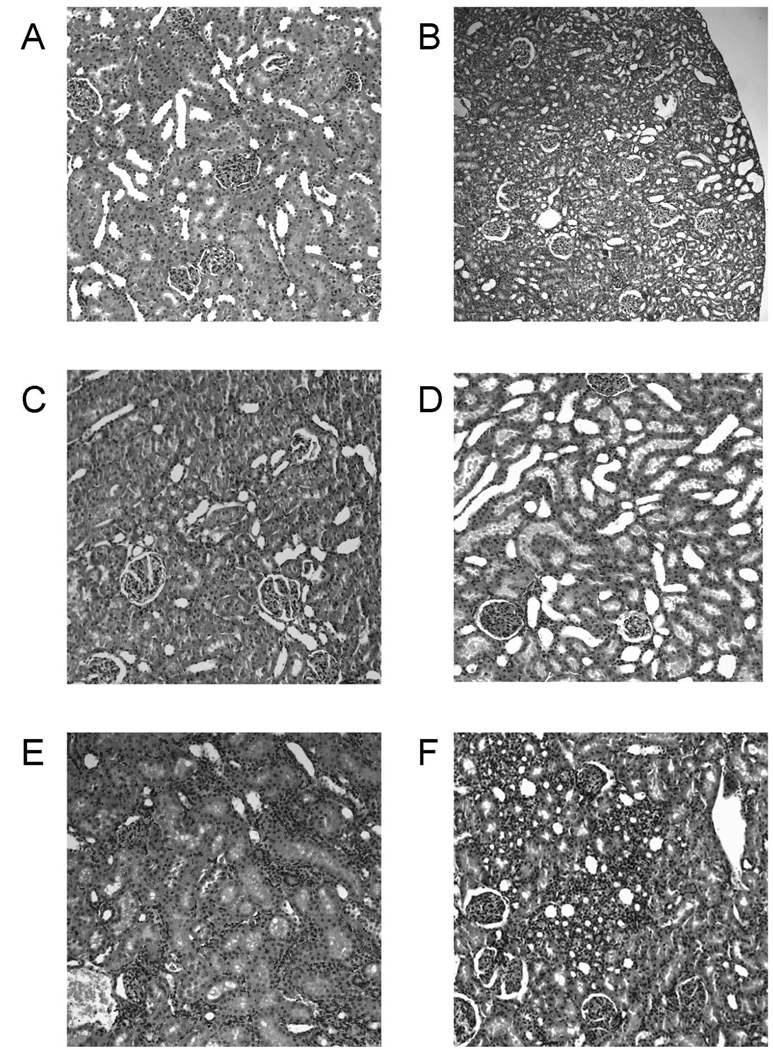
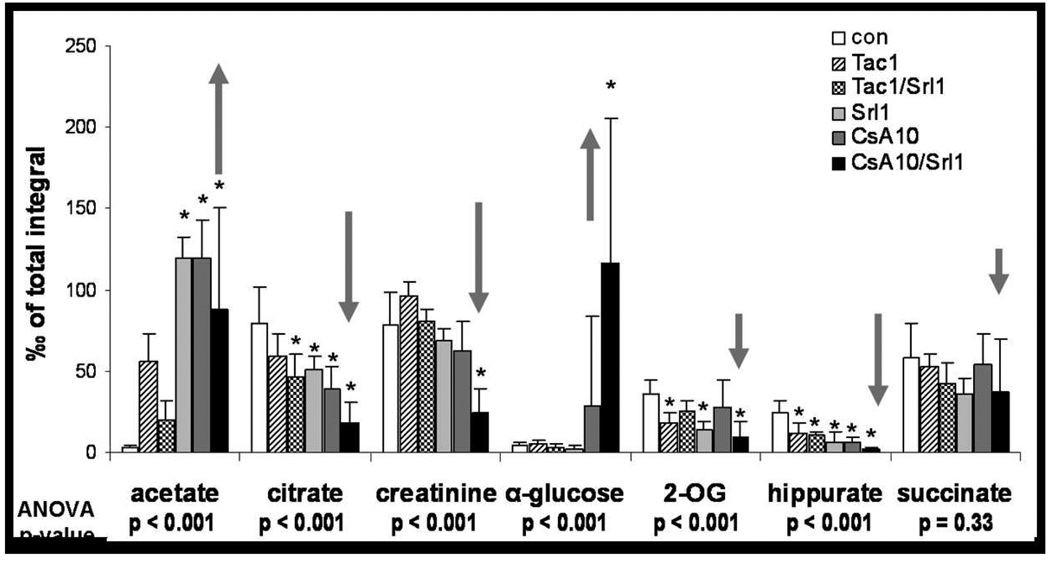
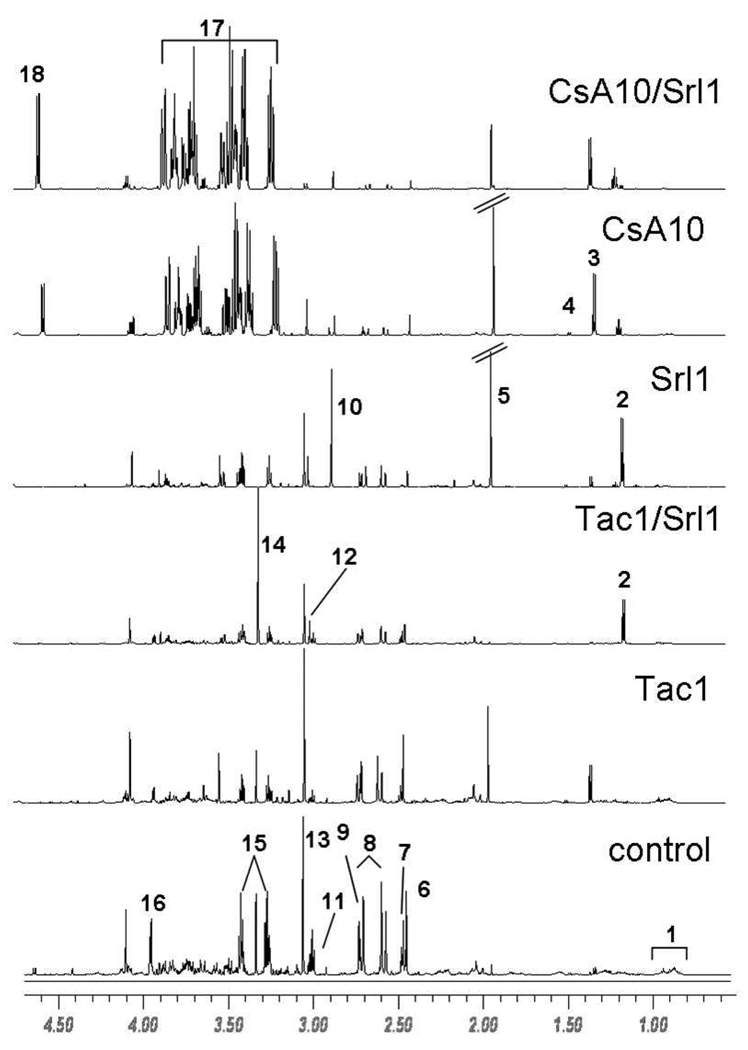
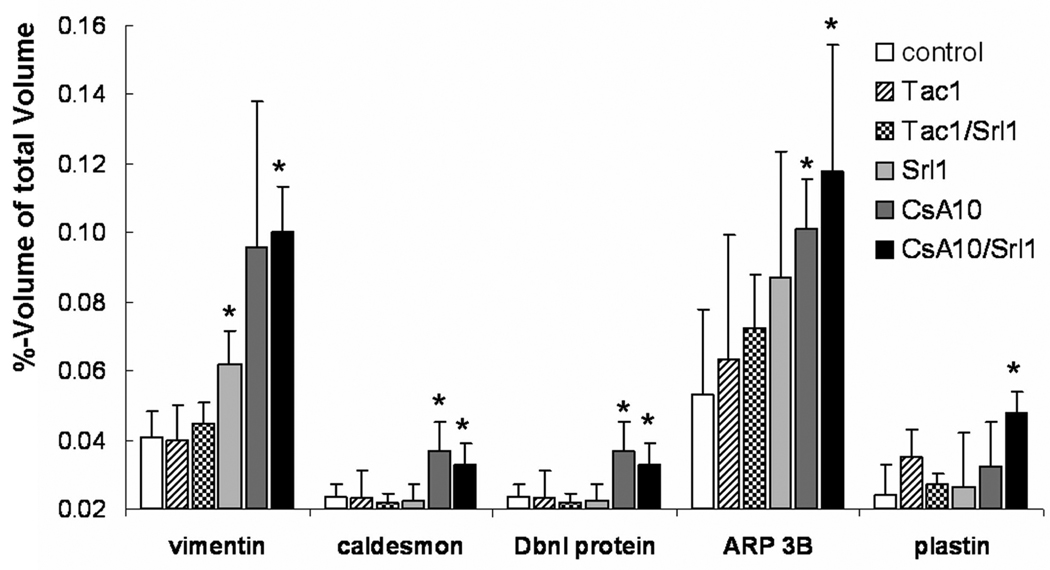
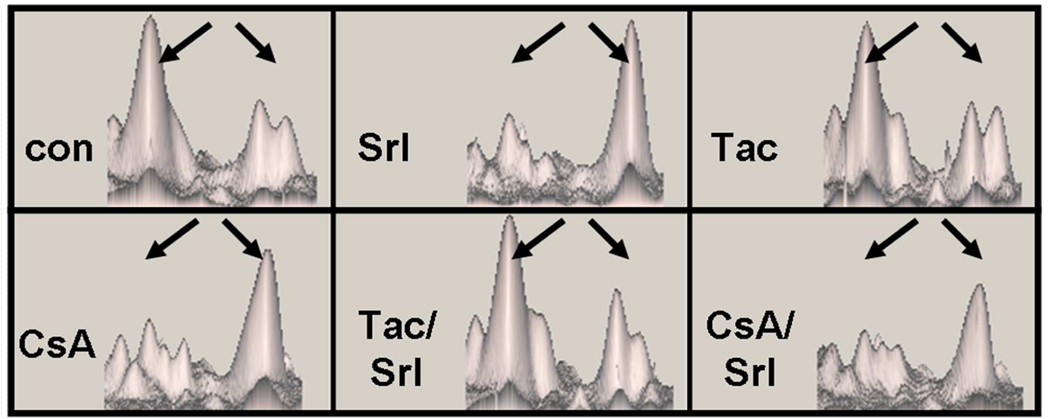
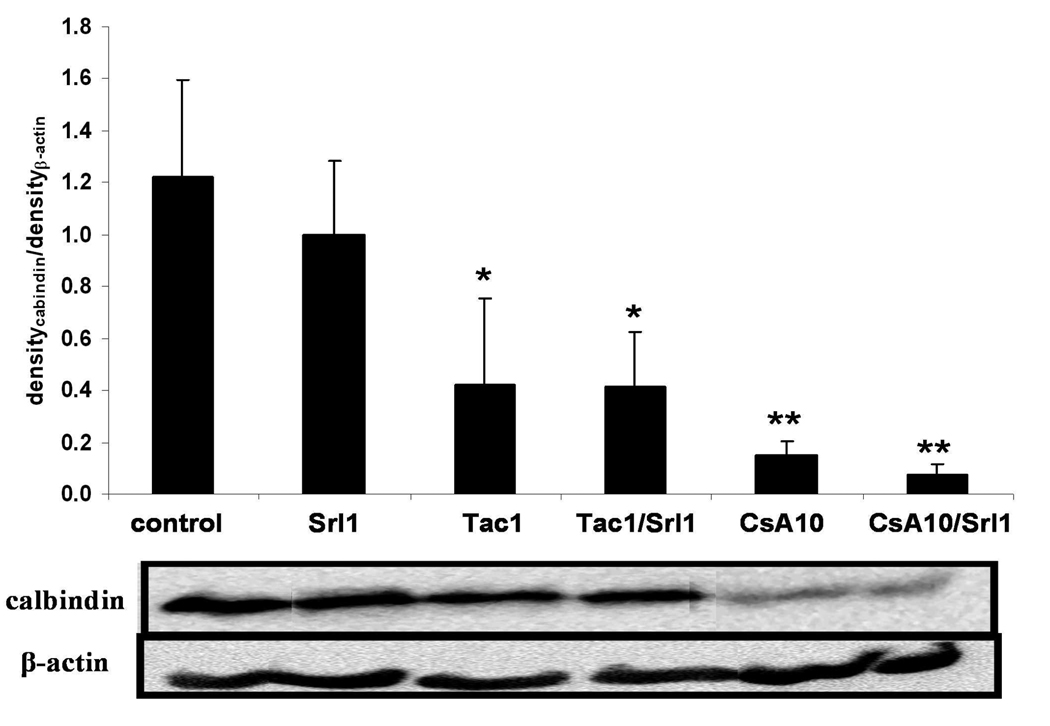
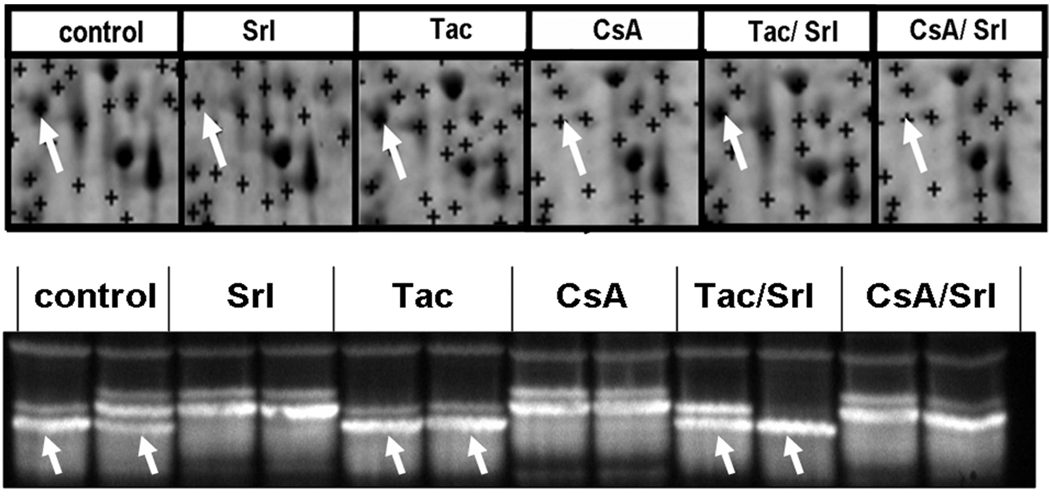
The basic mechanisms underlying calcineurin inhibitor (CI) nephrotoxicity and its enhancement by sirolimus are still largely unknown. We investigated the effects of CIs alone and in combination with sirolimus on the renal proteome and correlated these effects with urine metabolite pattern changes. Thirty-six male Wistar rats were assigned to six treatment groups (n = 4/group for proteome analysis and n = 6/group for urine (1)H NMR metabolite pattern analysis): vehicle controls, sirolimus 1 mg/kg/day, cyclosporine 10 mg/kg/day, cyclosporine 10 mg/kg/day + sirolimus 1 mg/kg/day, tacrolimus 1 mg/kg/day, tacrolimus 1 mg/kg/day + sirolimus 1 mg/kg/day. After 28 days, 24 h-urine was collected for (1)H NMR-based metabolic analysis and kidneys were harvested for 2D-gel electrophoresis and histology. Cyclosporine affected the following groups of proteins: calcium homeostasis (regucalcin, calbindin), cytoskeleton (vimentin, caldesmon), response to hypoxia and mitochondrial function (prolyl 4-hydroxylase, proteasome, NADH dehydrogenase), and cell metabolism (kidney aminoacylase, pyruvate dehydrogenase, fructose-1,6-bis phosphate). Several of the changes in protein expression, confirmed by Western blot, were associated with and explained changes in metabolite concentrations in urine. Representative examples are an increase in kidney aminoacylase expression (decrease of hippurate concentrations in urine), up regulation of pyruvate dehydrogenase and fructose-1,6-bisphosphatase, (increased glucose metabolism), and down regulation of arginine/glycine-amidino transferase (most likely due to an increase in creatinine concentrations). Protein changes explained and qualified immunosuppressant-induced metabolite pattern changes in urine.
Figures
Similar articles
-
Urine metabolites reflect time-dependent effects of cyclosporine and sirolimus on rat kidney function.Chem Res Toxicol. 2009 Jan;22(1):118-28. doi: 10.1021/tx800253x. Chem Res Toxicol. 2009. PMID: 19099400 Free PMC article.
-
Everolimus and sirolimus in combination with cyclosporine have different effects on renal metabolism in the rat.PLoS One. 2012;7(10):e48063. doi: 10.1371/journal.pone.0048063. Epub 2012 Oct 31. PLoS One. 2012. PMID: 23118926 Free PMC article.
-
Metabolic profiles in urine reflect nephrotoxicity of sirolimus and cyclosporine following rat kidney transplantation.Nephron Exp Nephrol. 2009;111(4):e80-91. doi: 10.1159/000209208. Epub 2009 Mar 17. Nephron Exp Nephrol. 2009. PMID: 19293597
-
Toxicodynamic therapeutic drug monitoring of immunosuppressants: promises, reality, and challenges.Ther Drug Monit. 2008 Apr;30(2):151-8. doi: 10.1097/FTD.0b013e31816b9063. Ther Drug Monit. 2008. PMID: 18367974 Review.
-
Calcineurin inhibitor-sparing regimens in solid organ transplantation: focus on improving renal function and nephrotoxicity.Clin Transplant. 2008 Jan-Feb;22(1):1-15. doi: 10.1111/j.1399-0012.2007.00739.x. Clin Transplant. 2008. PMID: 18217899 Review.
Cited by
-
Biomarkers of acute kidney injury.J Toxicol. 2011;2011:328120. doi: 10.1155/2011/328120. Epub 2011 Oct 29. J Toxicol. 2011. PMID: 22131986 Free PMC article.
-
Biomarkers of immunosuppressant organ toxicity after transplantation: status, concepts and misconceptions.Expert Opin Drug Metab Toxicol. 2011 Feb;7(2):175-200. doi: 10.1517/17425255.2011.544249. Expert Opin Drug Metab Toxicol. 2011. PMID: 21241200 Free PMC article. Review.
-
Toxicodynamic effects of ciclosporin are reflected by metabolite profiles in the urine of healthy individuals after a single dose.Br J Clin Pharmacol. 2010 Aug;70(2):241-51. doi: 10.1111/j.1365-2125.2010.03689.x. Br J Clin Pharmacol. 2010. PMID: 20653677 Free PMC article. Clinical Trial.
-
Regucalcin as a potential biomarker for metabolic and neuronal diseases.Mol Cell Biochem. 2014 Jun;391(1-2):157-66. doi: 10.1007/s11010-014-1998-2. Epub 2014 Mar 6. Mol Cell Biochem. 2014. PMID: 24599745 Review.
-
Mycophenolate mofetil enhances the negative effects of sirolimus and tacrolimus on rat kidney cell metabolism.PLoS One. 2014 Jan 30;9(1):e86202. doi: 10.1371/journal.pone.0086202. eCollection 2014. PLoS One. 2014. PMID: 24497939 Free PMC article.
References
-
- Wong W, Venetz JP, Tolkoff-Rubin N, Pascual M. 2005 immunosuppressive strategies in kidney transplantation: which role for the calcineurin inhibitors? Transplantation. 2005;80(3):289. - PubMed
-
- Taylor AL, Watson CJ, Bradley JA. Immunosuppressive agents in solid organ transplantation: Mechanisms of action and therapeutic efficacy. Crit Rev Oncol Hematol. 2005;56(1):23. - PubMed
-
- Ojo AO, Held PJ, Port FK, et al. Chronic renal failure after transplantation of a nonrenal organ. N Engl J Med. 2003;349(10):931. - PubMed
-
- Ponticelli C, Tarantino A. Promising new agents in the prevention of transplant rejection. Drugs R D. 1999;1(1):55. - PubMed
-
- Kahan BD The Rapamune US Study Group. Efficacy of sirolimus compared with azathioprine for reduction of acute renal allograft rejection: a randomised multicentre study. Lancet. 2000;356(9225):194. - PubMed
Publication types
MeSH terms
Substances
Grants and funding
LinkOut - more resources
Full Text Sources
Other Literature Sources
Miscellaneous
