

The structure of the proline utilization a proline dehydrogenase domain inactivated by N-propargylglycine provides insight into conformational changes induced by substrate binding and flavin reduction
- PMID: 19994913
- PMCID: PMC3727237
- DOI: 10.1021/bi901717s
The structure of the proline utilization a proline dehydrogenase domain inactivated by N-propargylglycine provides insight into conformational changes induced by substrate binding and flavin reduction
Abstract
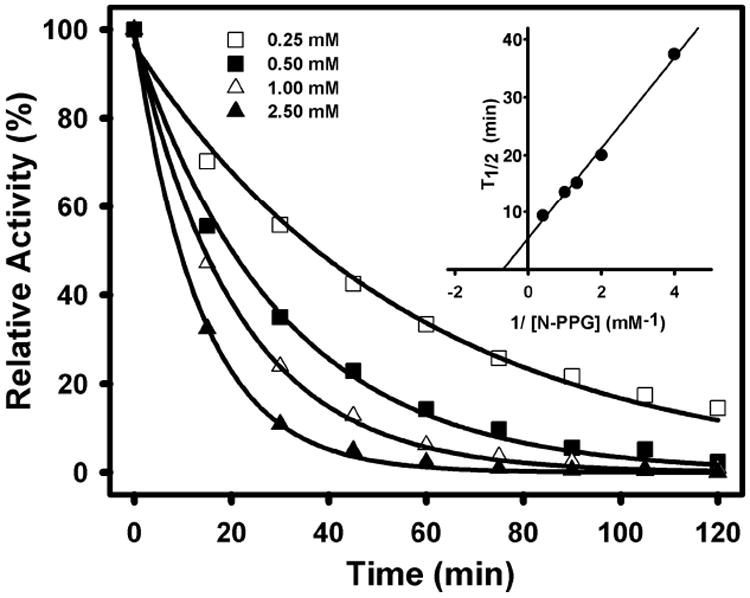
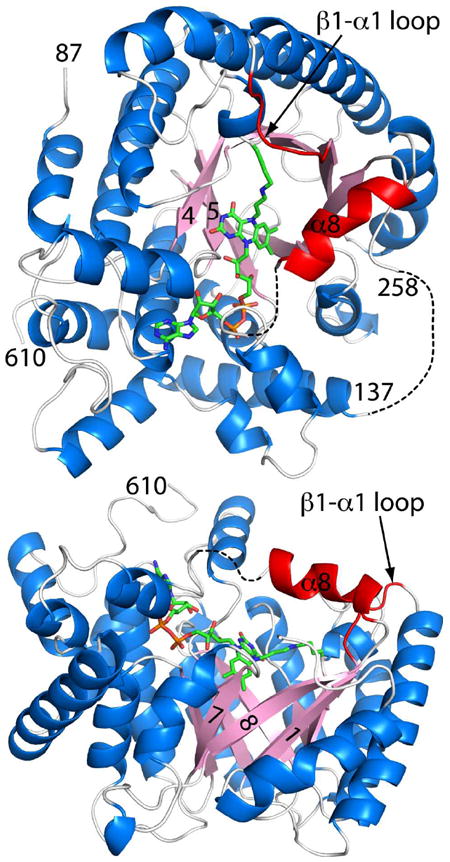
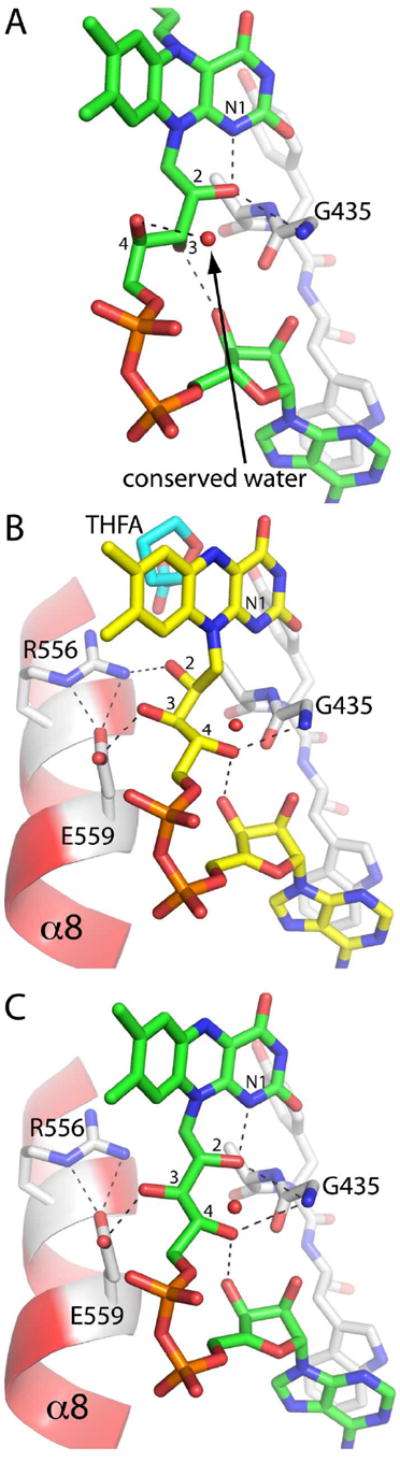
Proline utilization A (PutA) from Escherichia coli is a flavoprotein that has mutually exclusive roles as a transcriptional repressor of the put regulon and a membrane-associated enzyme that catalyzes the oxidation of proline to glutamate. Previous studies have shown that the binding of proline in the proline dehydrogenase (PRODH) active site and subsequent reduction of the FAD trigger global conformational changes that enhance PutA-membrane affinity. These events cause PutA to switch from its repressor to its enzymatic role, but the mechanism by which this signal is propagated from the active site to the distal membrane-binding domain is largely unknown. Here, it is shown that N-propargylglycine irreversibly inactivates PutA by covalently linking the flavin N(5) atom to the epsilon-amino of Lys329. Furthermore, inactivation locks PutA into a conformation that may mimic the proline-reduced, membrane-associated form. The 2.15 A resolution structure of the inactivated PRODH domain suggests that the initial events involved in broadcasting the reduced flavin state to the distal membrane-binding domain include major reorganization of the flavin ribityl chain, severe (35 degrees ) butterfly bending of the isoalloxazine ring, and disruption of an electrostatic network involving the flavin N(5) atom, Arg431, and Asp370. The structure also provides information about conformational changes associated with substrate binding. This analysis suggests that the active site is incompletely assembled in the absence of the substrate, and the binding of proline draws together conserved residues in helix 8 and the beta1-alphal loop to complete the active site.
Figures


Similar articles
-
Structure, function, and mechanism of proline utilization A (PutA).Arch Biochem Biophys. 2017 Oct 15;632:142-157. doi: 10.1016/j.abb.2017.07.005. Epub 2017 Jul 14. Arch Biochem Biophys. 2017. PMID: 28712849 Free PMC article. Review.
-
Redox-induced changes in flavin structure and roles of flavin N(5) and the ribityl 2'-OH group in regulating PutA--membrane binding.Biochemistry. 2007 Jan 16;46(2):483-91. doi: 10.1021/bi061935g. Biochemistry. 2007. PMID: 17209558 Free PMC article.
-
Involvement of the β3-α3 loop of the proline dehydrogenase domain in allosteric regulation of membrane association of proline utilization A.Biochemistry. 2013 Jul 2;52(26):4482-91. doi: 10.1021/bi400396g. Epub 2013 Jun 19. Biochemistry. 2013. PMID: 23713611 Free PMC article.
-
Structures of the Escherichia coli PutA proline dehydrogenase domain in complex with competitive inhibitors.Biochemistry. 2004 Oct 5;43(39):12539-48. doi: 10.1021/bi048737e. Biochemistry. 2004. PMID: 15449943 Free PMC article.
-
Direct linking of metabolism and gene expression in the proline utilization A protein from Escherichia coli.Amino Acids. 2008 Nov;35(4):711-8. doi: 10.1007/s00726-008-0053-6. Epub 2008 Mar 7. Amino Acids. 2008. PMID: 18324349 Free PMC article. Review.
Cited by
-
Proline and hydroxyproline metabolism: implications for animal and human nutrition.Amino Acids. 2011 Apr;40(4):1053-63. doi: 10.1007/s00726-010-0715-z. Epub 2010 Aug 10. Amino Acids. 2011. PMID: 20697752 Free PMC article. Review.
-
Biochemical, structural, and cellular characterization of S-but-3-yn-2-ylglycine as a mechanism-based covalent inactivator of the flavoenzyme proline dehydrogenase.Arch Biochem Biophys. 2025 Mar;765:110319. doi: 10.1016/j.abb.2025.110319. Epub 2025 Jan 25. Arch Biochem Biophys. 2025. PMID: 39870289
-
Structure, function, and mechanism of proline utilization A (PutA).Arch Biochem Biophys. 2017 Oct 15;632:142-157. doi: 10.1016/j.abb.2017.07.005. Epub 2017 Jul 14. Arch Biochem Biophys. 2017. PMID: 28712849 Free PMC article. Review.
-
N-Propargylglycine: a unique suicide inhibitor of proline dehydrogenase with anticancer activity and brain-enhancing mitohormesis properties.Amino Acids. 2021 Dec;53(12):1927-1939. doi: 10.1007/s00726-021-03012-9. Epub 2021 Jun 5. Amino Acids. 2021. PMID: 34089390 Free PMC article.
-
Noncovalent Inhibition and Covalent Inactivation of Proline Dehydrogenase by Analogs of N-Propargylglycine.Biochemistry. 2024 Nov 5;63(21):2855-2867. doi: 10.1021/acs.biochem.4c00429. Epub 2024 Oct 22. Biochemistry. 2024. PMID: 39437336
References
-
- Abrahamson JL, Baker LG, Stephenson JT, Wood JM. Proline dehydrogenase from Escherichia coli K12. Properties of the membrane-associated enzyme. Eur J Biochem. 1983;134:77–82. - PubMed
-
- Brown ED, Wood JM. Redesigned purification yields a fully functional PutA protein dimer from Escherichia coli. J Biol Chem. 1992;267:13086–13092. - PubMed
Publication types
MeSH terms
Substances
Associated data
- Actions
Grants and funding
LinkOut - more resources
Full Text Sources
Molecular Biology Databases
