. 2009 Dec 16;131(49):17843-52.
doi: 10.1021/ja905457d.

Structures of beta-amyloid peptide 1-40, 1-42, and 1-55-the 672-726 fragment of APP-in a membrane environment with implications for interactions with gamma-secretase

Affiliations

Structures of beta-amyloid peptide 1-40, 1-42, and 1-55-the 672-726 fragment of APP-in a membrane environment with implications for interactions with gamma-secretase

Naoyuki Miyashita et al. J Am Chem Soc. .

Abstract

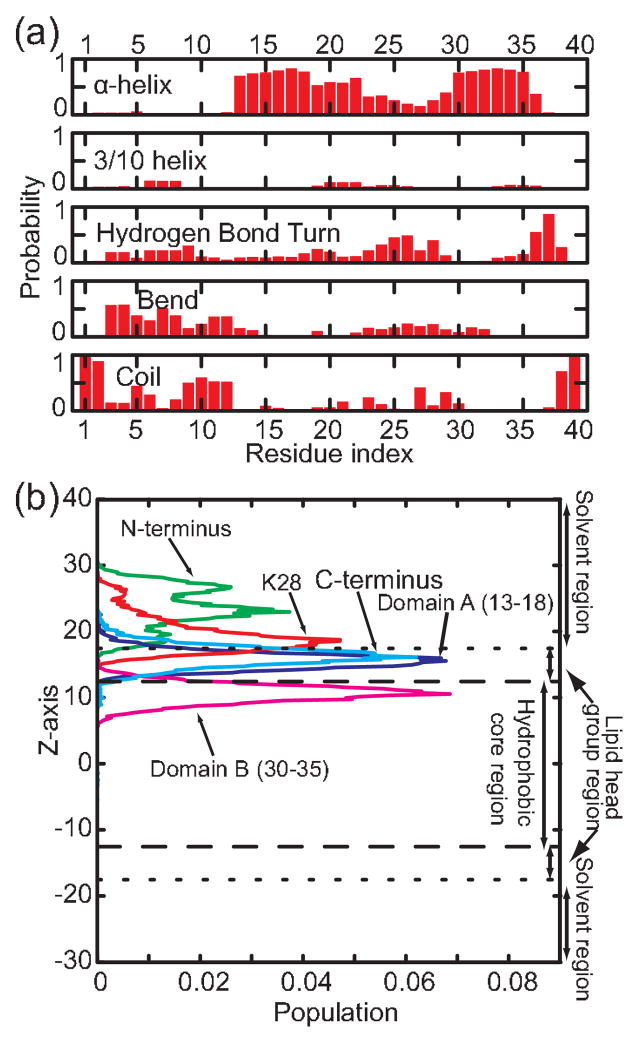
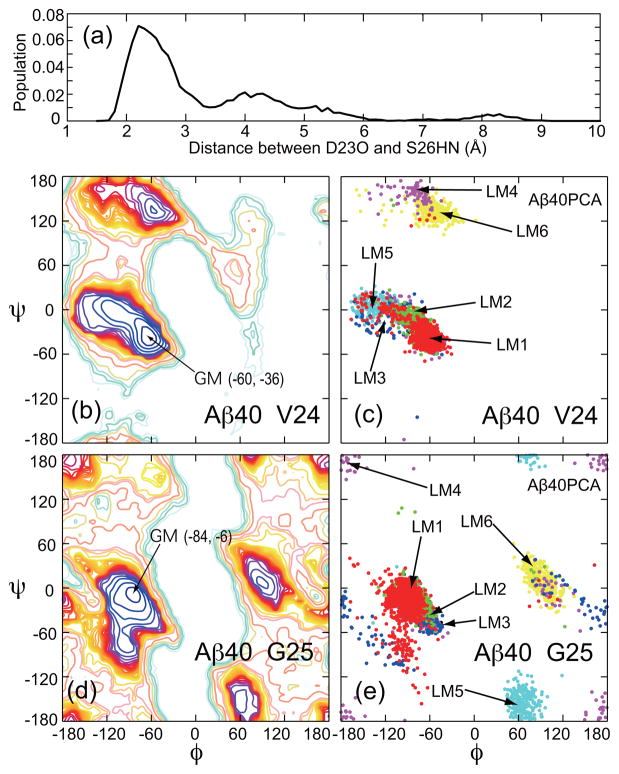
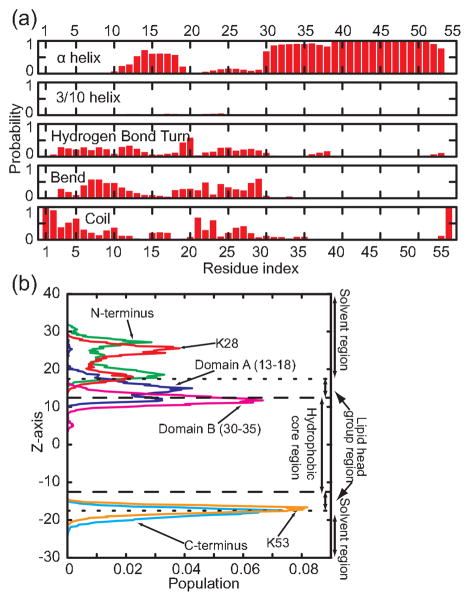
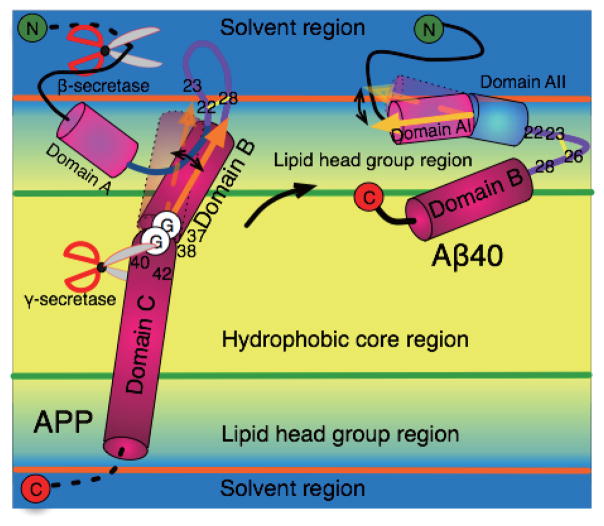
Aggregation of Amyloid beta (Abeta) peptide has been linked to the neurodegenerative Alzheimer's Disease and implicated in other amyloid diseases including cerebral amyloid angiopathy. Abeta peptide is generated by cleavage of the amyloid precursor protein (APP) by transmembrane proteases. It is crucial to determine the structures of beta-amyloid peptides in a membrane to provide a molecular basis for the cleavage mechanism. We report the structures of amyloid beta peptide (Abeta(1-40) and Abeta(1-42)) as well as the 672-726 fragment of APP (referred to as Abeta(1-55)) in a membrane environment determined by replica-exchange molecular dynamics simulation. Abeta(1-40) is found to have two helical domains A (13-22) and B(30-35) and a type I beta-turn at 23-27. The peptide is localized at the interface between membrane and solvent. Substantial fluctuations in domain A are observed. The dominant simulated tertiary structure of Abeta(1-40) is observed to be similar to the simulated Abeta(1-42) structure. However, there are differences observed in the overall conformational ensemble, as characterized by the two-dimensional free energy surfaces. The fragment of APP (Abeta(1-55)) is observed to have a long transmembrane helix. The position of the transmembrane region and ensemble of membrane structures are elucidated. The conformational transition between the transmembrane Abeta(1-55) structure, prior to cleavage, and the Abeta(1-40) structure, following cleavage, is proposed.


Figures

Figure 1
Figure 1
(a) The secondary structure content for residues of Aβ140 at 300K. (b)The population of domains and sites of Aβ140 at 300K. The dashed and dotted lines indicate the interface between the lipid head group region and the hydrophobic core region of the membrane, and the interface between the membrane and solvent, respectively. The positions of the N-terminus (green), domain A (13–18) (blue), Nζ of Lys28 (red), domain B (30–35) (magenta) and C-terminus (cyan) are shown. The vertical axis indicates the z-axis oriented normal to the membrane surface.
Figure 2
Figure 2
The first (a) and second (b) principal component vectors are shown in stereo (para). The structures are representative of the ensemble of Aβ140 peptide structures occupying the global minimum of the free energy landscape. The orange and green horizontal lines demonstrate the solvent-membrane and lipid interfaces, respectively. The yellow allows indicate the domain vectors (AI (a⃗) and B (b⃗)). The vectors of the domain (AI and B) are defined as a⃗ = p⃗1p⃗2 and b⃗ = s⃗2s⃗1 respectively, where p⃗1, p⃗2, s⃗1, and s⃗2 are the averaged position of the center of geometry of the heavy atoms of the residues 12–17, 14–19, 29–34, and 31–36. The purple and green arrows represent the first and second principal component vectors, which indicate fluctuations of the domains. The illustrations were prepared using VMD and Raster3D.
Figure 3
Figure 3
(a)Free energy landscape of Aβ140 at 300K shown as a function of the first principal axis (PC1) and the second principal axis (PC2). The interval between the contour lines were set to 0.5kcal/mol for 0–10 kcal/mol (black-blue-purple-red), 1kcal/mol for 10–20 (red-yellow), 10 kcal/mol for 20–50 (yellow-light pink) and 50 kcal/mol for 50–300 kcal/mol (light pink-light cyan-white). LM1, 2, 3, 4, 5, 6 and LM7 (Aβ40PCA) are structures of high probability indicative of the associated local minima basins. LM1 is the global minimum structure. Orange horizontal lines define the interface between membrane and solvent, and green horizontal lines define the interface between the lipid head group region and the hydrophobic core region of the membrane. The secondary structure is shown by color as red (α-helices), pink (3/10-helices), green (turn), cyan (bend), and white (coil). The side chains of three residues Glu22, Asp23, and Lys28, are shown explicitly in the figure. The illustrations were prepared using VMD and Raster3D. (b)Free energy landscape of Aβ140 at 300K along the θ and α axes. The interval between the contour lines are same as (a). The labels LM1, 2, 3, 4, 5, 6 and -LM7 (Aβ40θα) indicate local minima basins. LM1 is the global minimum basin. (c) The local minimum basin structures derived from the PCA are projected onto the θ-α space. The local minima basin structures derived from the PCA (Aβ40PCA) indicated by dots are LM1 (red), 2 (green), 3 (blue), 4 (magenta), 5 (cyan), 6 (yellow) and LM7 (black).
Figure 4
Figure 4
(a) The population of the distance between Asp23O and Ser26HN. The most populated distance is 2.2. The free energy landscapes of Aβ140 at 300K projected on the backbone φ and ψ axes of residues Val24 and Gly25 are shown in (b) and (d), respectively. GM is global minimum basin. The structures of the PCA (Aβ40PCA) represent LM1(red), LM2(green), LM3(blue), LM4(magenta), LM5(cyan), LM6(yellow) and LM7(black) are projected onto the φ-ψ space of Val24 (c) and Gly25 (e).
Figure 5
Figure 5
(a) The secondary structure content of residues of Aβ155 at 300K. (b) The population of domains and sites of Aβ155 at 300K. The dashed and dotted lines indicate the interface between the lipid head group region and the hydrophobic core region of the membrane, and the interface between the membrane and solvent. Also shown are the distributions of the position of the N-terminus (green), domain A (13–18) (blue), Nε at Lys28 (red), domain B (30–35) (magenta), C-terminus (cyan), and Nε of Lys53 (orange) projected onto the z-axis, which is normal to the solvent -membrane interface.
Figure 6
Figure 6
The first (a) and second (b) principal component vectors are depicted in stereo (para) using the global minimum structure of Aβ155. The vectors (green and orange) extending over residues 1–40 in Aβ155 portray displacements in the directions of the principal component eigen-vectors. See Figure 2 for definitions of graphical elements. The figure was illustrated using VMD and Raster3D.
Figure 7
Figure 7
(a) Free energy landscape along the PC1 and PC2 axes at 300K for Aβ155. The intervals between the contour lines are set to 0.5kcal/mol for 0–10 kcal/mol (black-blue-purple-red), 1kcal/mol for 10–20 (red-yellow), 10 kcal/mol for 20–50 (yellow-light pink) and 50 kcal/mol for 50–300 kcal/mol (light pink-light cyan-white), respectively. Characteristic structures representing the local minima basins are labeled (Aβ55PCA)-LM1, 2, 3, 4, 5, 6 and LM7. (Aβ55PCA)-LM1 is the global minimum structure. Orange horizontal lines depict the interface between membrane and solvent, and green horizontal lines indicate the interface between the lipid head group region and hydrophobic core region in the membrane. The protein’s secondary structure is shown by color as red (α-helices), pink (3/10-helices), green (turn), cyan (bend), and white (coil). The six key residues, Glu22, Asp23, Lys28, Glys29, Gly33, and Gly38 are shown explicitly. The figures were illustrated using VMD and Raster3D. (b) Free energy landscape projected on the θ and α axes at 300K for the Aβ155. The interval between the contour lines are same as (a). Aβ 55θα-LM1, 2, 3, 4, 5 and -LM6 are local minima basins and LM1 is the global minimum basin. (c) The protein structures characteristic of each local minimum basin are projected into the θ-α space. The structures indicated by dots are (Aβ55PCA)-LM1(red), 2 (green), 3 (blue), 4 (magenta), 5 (cyan), 6 (yellow) and LM7 (black). (d)Free energy landscape projected on the γ-α plane at 300K. γ is the angle between the domain C (35–52) vector and the z-axis. The interval between the contour lines are same as (a). (e) The local minimum basin structures characteristic of each local minimum basin were projected onto the γ-α space. The dots are the same as (c).
Figure 8
Figure 8
A schematic view of APP (Aβ155) and Aβ140 in a membrane. Orange and green lines indicate the interface between the lipid head group region and the hydrophobic core region of the membrane, and the interface between the membrane and solvent, respectively. Yellow lines indicate the hydrogen bond (22–28 for APP, 23–26 for Aβ140). Orange and yellow arrows indicate the vector of domain B in Aβ155 and the vector of domain AI in Aβ140. The helical domains A (13–22), AI (13–18), AII (19–22), B (30–35), and C (39–52) are represented by cylinders.
Figure 9
Figure 9
The membrane regions of Aβ140 and Aβ155 are shown, where white, gray, and black indicate the solvent region, the lipid head group region, and the hydrophobic core region, respectively. Light gray or dark gray (gradation) are used if the residues are close to the solvent or hydrophobic core regions.
Figure 10
Figure 10
The α helix content for residues of Aβ142 and free energy landscape along the θ and α axes for Aβ142 at 300K. The interval between the contour lines is set to 0.5kcal/mol for 0–10 kcal/mol (black-blue-purple-red), 1 for 10–20 (red-yellow), 10 for 20–50 (yellow-lightpink) and 50 for 50–300 kcal/mol (lightpink-light cyan-white). The labels LM1, 2, and LM3 indicate local minima basins. LM1 is the global minimum basin.

Similar articles

Cited by

References

    1. Iversen L, Mortishire-Smith R, Pollack S, Shearman M. Biochem J. 1995;311:1–16. - PMC - PubMed
    1. Pike C, Walencewicz-Wasserman A, Kosmoski J, Cribbs D, Glabe C, Cotman C. J Neurochem. 1995;64:253–265. - PubMed
    1. Simmons L, May P, Tomaselli K, Rydel R, Fuson K, Brigham E, Wright S, Lieberburg I, Becker G, Brems D. Mol Pharma. 1994;45:373–379. - PubMed
    1. Lynn DG, Meredith SC. J Struct Biol. 2000;130:153–173. - PubMed
    1. Haass C, Selkoe DJ. Nat Rev Mol Cell Biol. 2007;8:101–112. - PubMed

Publication types

MeSH terms

Substances