Comparative Study
. 2009 Dec 8:10:588.
doi: 10.1186/1471-2164-10-588.

The pitfalls of platform comparison: DNA copy number array technologies assessed

Affiliations
Comparative Study

The pitfalls of platform comparison: DNA copy number array technologies assessed

Christina Curtis et al. BMC Genomics. .

Abstract

Background: The accurate and high resolution mapping of DNA copy number aberrations has become an important tool by which to gain insight into the mechanisms of tumourigenesis. There are various commercially available platforms for such studies, but there remains no general consensus as to the optimal platform. There have been several previous platform comparison studies, but they have either described older technologies, used less-complex samples, or have not addressed the issue of the inherent biases in such comparisons. Here we describe a systematic comparison of data from four leading microarray technologies (the Affymetrix Genome-wide SNP 5.0 array, Agilent High-Density CGH Human 244A array, Illumina HumanCNV370-Duo DNA Analysis BeadChip, and the Nimblegen 385 K oligonucleotide array). We compare samples derived from primary breast tumours and their corresponding matched normals, well-established cancer cell lines, and HapMap individuals. By careful consideration and avoidance of potential sources of bias, we aim to provide a fair assessment of platform performance.

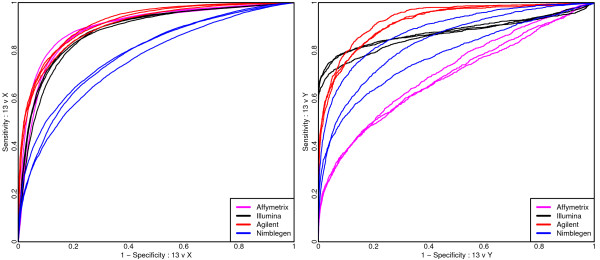
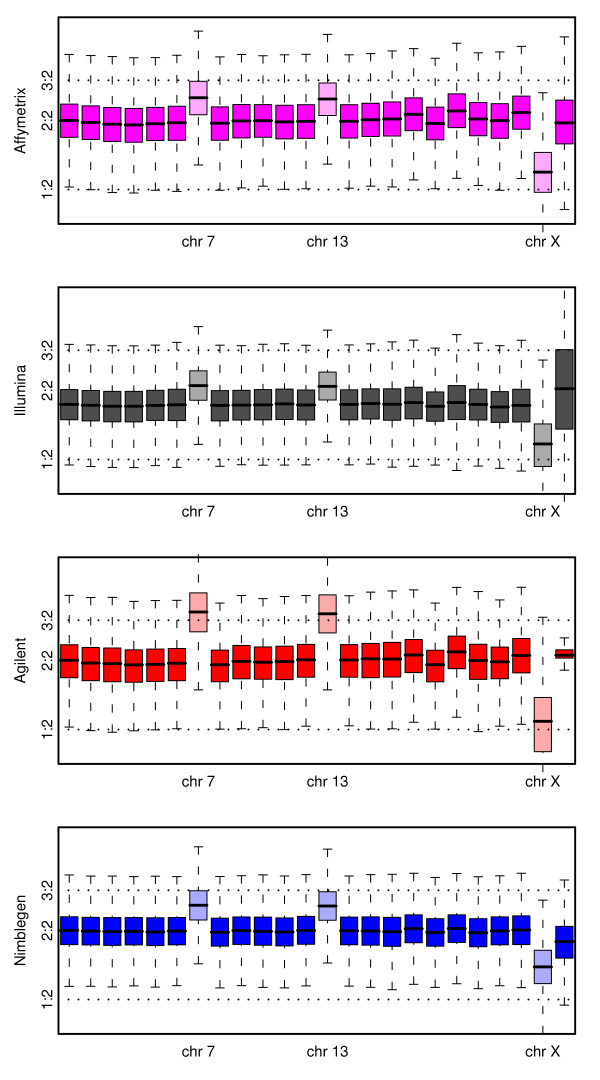
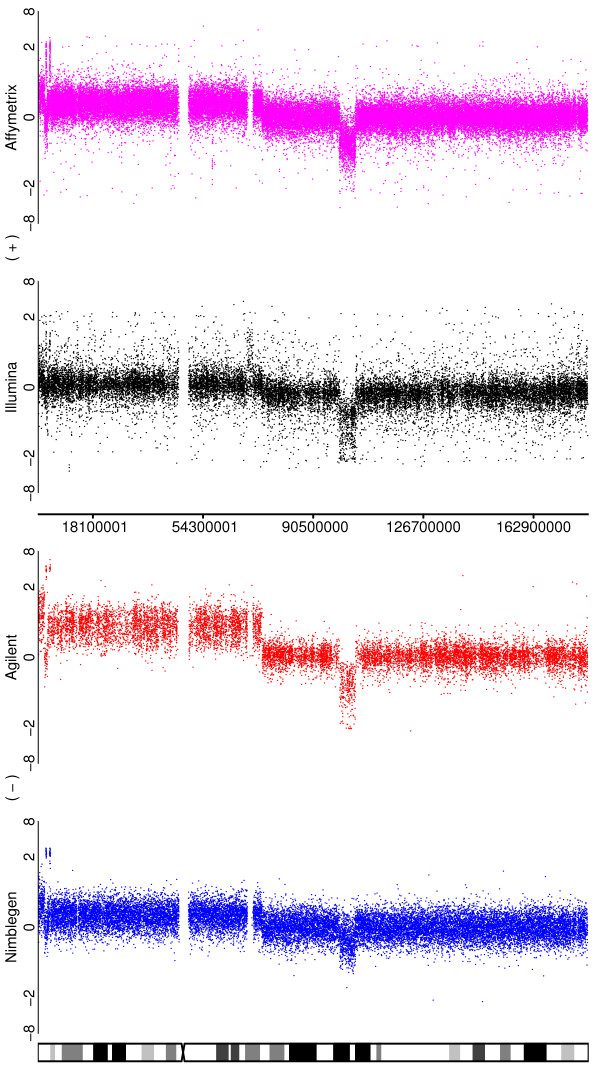
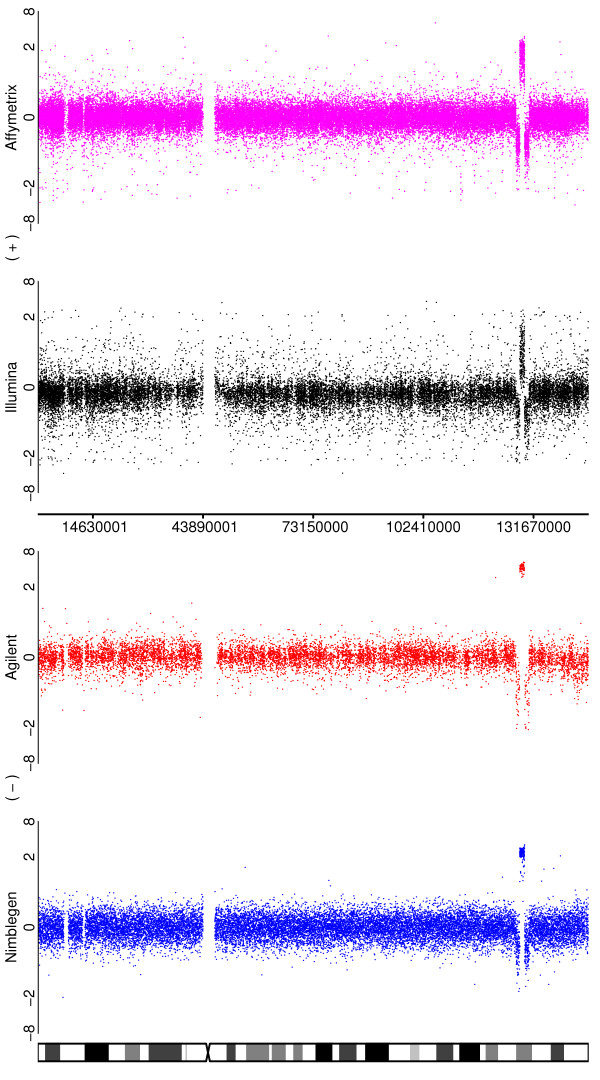
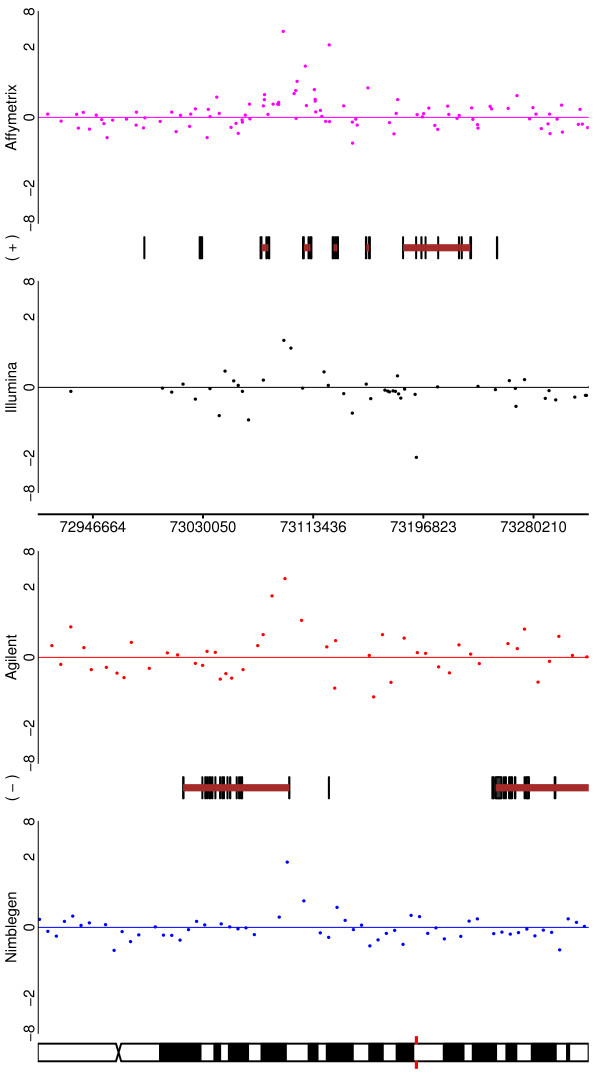
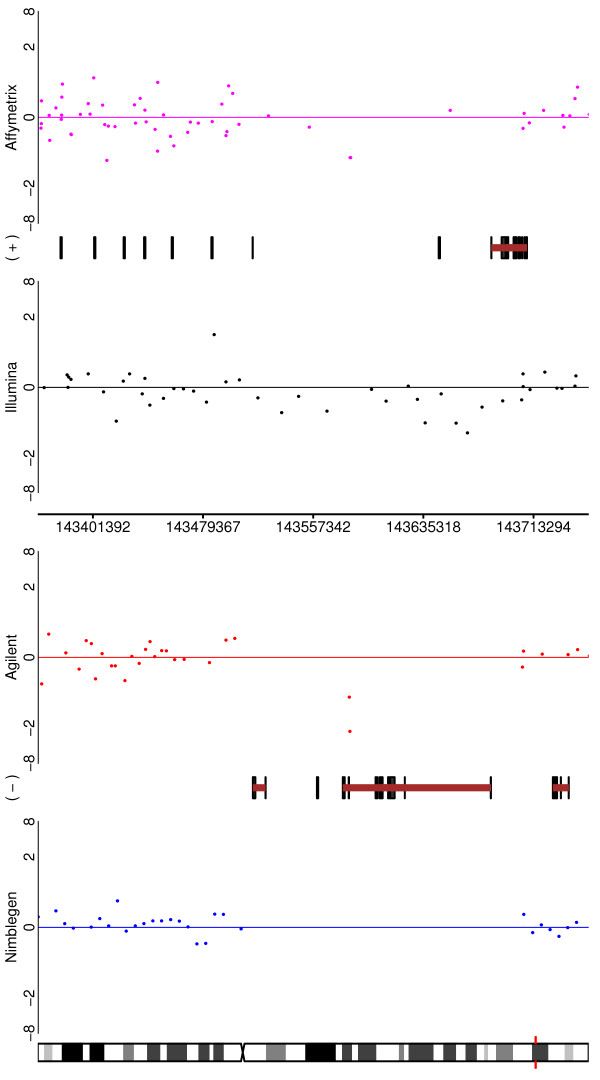
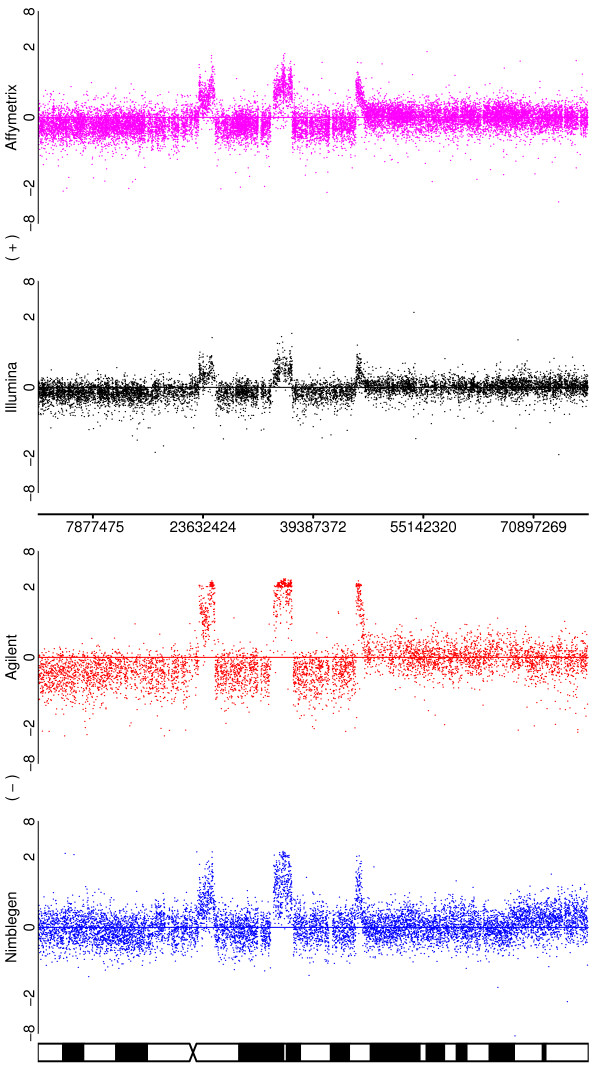
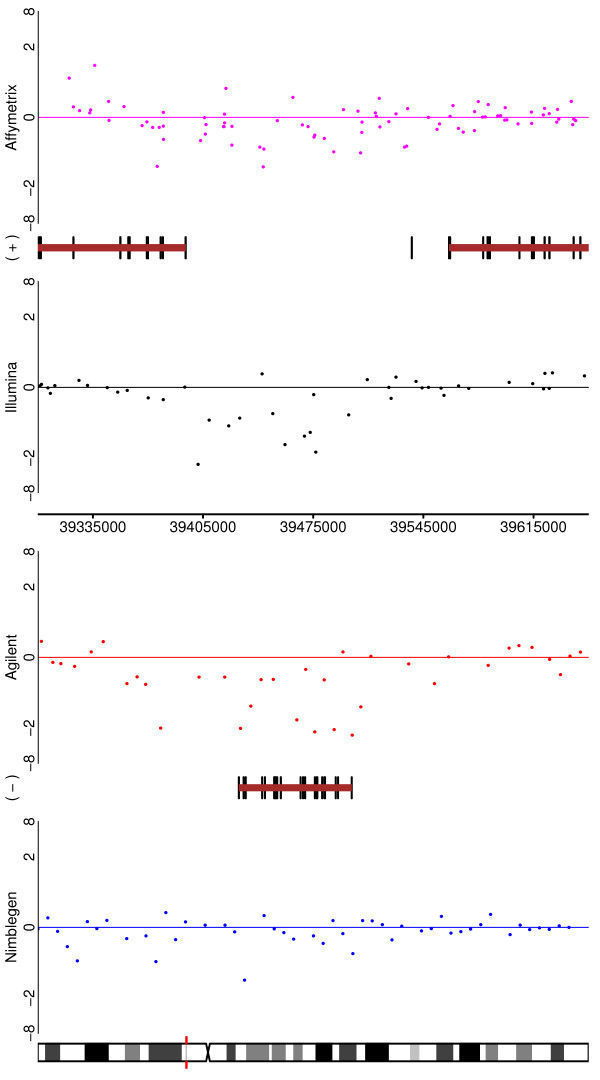
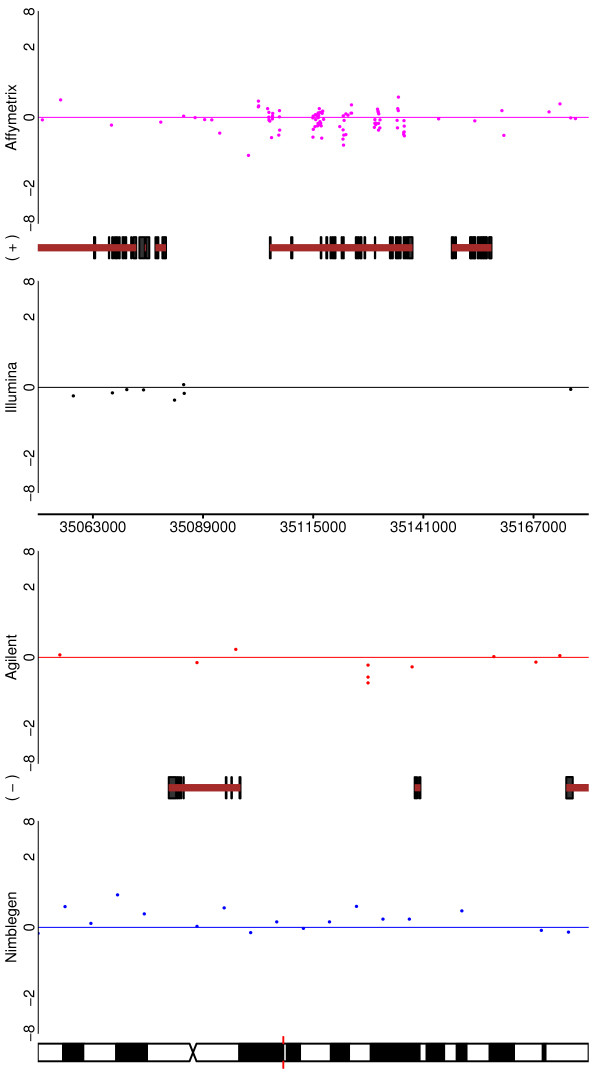
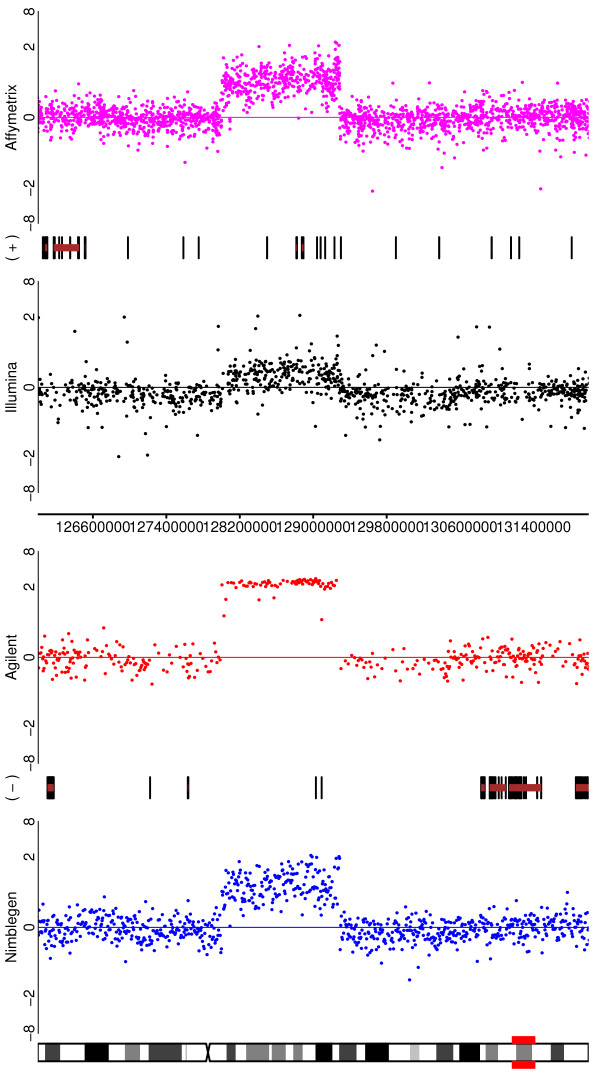
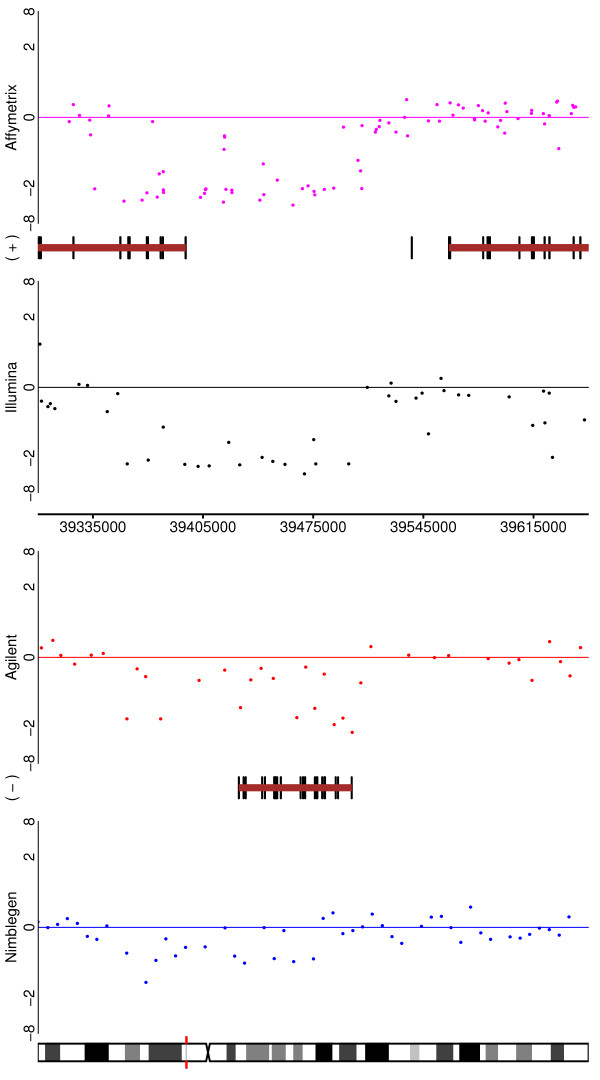
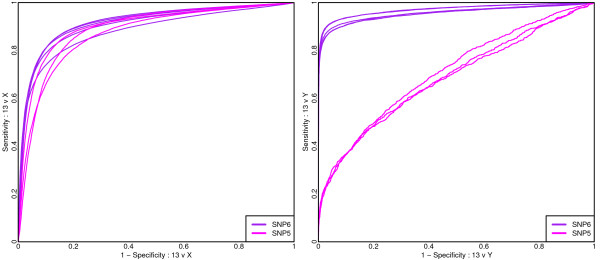
Results: By performing a theoretical assessment of the reproducibility, noise, and sensitivity of each platform, notable differences were revealed. Nimblegen exhibited between-replicate array variances an order of magnitude greater than the other three platforms, with Agilent slightly outperforming the others, and a comparison of self-self hybridizations revealed similar patterns. An assessment of the single probe power revealed that Agilent exhibits the highest sensitivity. Additionally, we performed an in-depth visual assessment of the ability of each platform to detect aberrations of varying sizes. As expected, all platforms were able to identify large aberrations in a robust manner. However, some focal amplifications and deletions were only detected in a subset of the platforms.

Conclusion: Although there are substantial differences in the design, density, and number of replicate probes, the comparison indicates a generally high level of concordance between platforms, despite differences in the reproducibility, noise, and sensitivity. In general, Agilent tended to be the best aCGH platform and Affymetrix, the superior SNP-CGH platform, but for specific decisions the results described herein provide a guide for platform selection and study design, and the dataset a resource for more tailored comparisons.


Figures

Figure 1
Figure 1
For a comparison of the HapMap samples ROC curves are presented to assess the performance of a single probe/probe-set for distinguishing the log-ratios associated with differing copy numbers from the log-ratios of chromosome 13 where copy-numbers should agree. Note the contrast from the left-hand panel, where the performances of Affymetrix and Agilent are indistinguishable, and the right hand panel, where the performance of Affymetrix has substantially declined.
Figure 2
Figure 2
Showing, for a comparison of the MT3 cell-line to a pooled normal reference, a boxplot of the log-ratios from each platform broken down by chromosome. Also indicated are theoretical markers for a single copy gain and a single copy loss. The three chromosomes with known aberrant copy number are indicated.
Figure 3
Figure 3
Illustrating the ability of the platforms to detect the duplication of a chromosomal arm. Depicted are the log-ratios for a comparison of the SUM159 cell line to a pooled normal reference for chromosome 5. In addition to a number of smaller aberrations, there is a duplication of the p arm of the chromosome for this sample.
Figure 4
Figure 4
Illustrating the ability of the platforms to detect high amplitude focal amplifications and other subchromosomal events. Depicted are the log-ratios for a comparison of the SUM159 cell line to a pooled normal reference for chromosome 8. A deletion, duplication, deletion aberrations pattern is clearly visible for all four platforms in the region of x = 130 Mb.
Figure 5
Figure 5
For one of the HapMap - HapMap CNVs (CNV58 from Additional File 3), depicted are the performances of all four platforms. The change is visible in each case, but with differing degrees of clarity.
Figure 6
Figure 6
For one of the HapMap - HapMap CNVs (CNV38 from Additional File 3), depicted are the performances of all four platforms. In this case the variant is not obvious (or even apparent) in three of the platforms due to poor coverage of the region. Nimblegen has no coverage, and Agilent and Affymetrix have relatively low coverage. However, these last two platforms do show the copy number variation with what probes they have. Illumina is less convincing on a probe-by-probe basis, but successfully demonstrates the CNV through sheer number of probes in the region.
Figure 7
Figure 7
Depicting Tumour 7214, Chromosome 17 for the four platforms (genes not shown).
Figure 8
Figure 8
Depicting, for Tumour 7207, the area around the ADAM3A gene for the four platforms.
Figure 9
Figure 9
Depicting, for Tumour 7207, the area around the ERBB2 gene for the four platforms. Note the poor coverage of the Illumina platform.
Figure 10
Figure 10
For comparison with figure 2: Depicting, for a dilution of the MT3 cell-line, compared to a pooled normal reference, a boxplot of the log-ratios from each platform broken down by chromosome. Also indicated are theoretical markers for a single copy gain and a single copy loss at this dilution level. The three chromosomes with known aberrant copy number are indicated.
Figure 11
Figure 11
Depicting, for a dilution of SUM159, the 8q region for the four platforms.
Figure 12
Figure 12
Depicting, for a dilution of Tumour 7207, the area around the ADAM3A gene for the four platforms.
Figure 13
Figure 13
For comparison with Figure 3. Here a comparison of the Affymetrix SNP5 and SNP6 platforms are shown. ROC curves are presented to assess the performance of a single probe/probe-set for distinguishing the log-ratios associated with differing copy numbers from the log-ratios of chromosome 13 (where copy-numbers should agree) for the HapMap pair of samples. For SNP6 five replicate HapMap/HapMap (NA15510 vs NA10851) comparisons are shown using raw data available from the Affymetrix X chromosome titration study.
Figure 14
Figure 14
For a pool-pool log-ratio comparison from the Affymetrix platform, depicted are the effect and distribution of probe GC content. Top: Showing the effect of GC content on log-ratio. Bottom: Showing the distribution of probe GC content.
Figure 15
Figure 15
For a pool-pool hybridization from the Agilent platform depicted are the distribution and effect of probe target length. Top left: depicted are numbers of probes apparently targeting sequences of different lengths, with modes at 60 and 45. Bottom left: Shown are the proportions of probes, for each autosomal chromosome, that have target length 60; a proportion that is lowest for chromosome 19. Note that the width of the bar is proportional to the total number of probes on that array. Right: Two boxplots depict the associations between probe target length and intensity, and probe target length and log-ratio. 60 mer target sequence lengths are associated with lower intensities and greater variance of log-ratio.
Figure 16
Figure 16
For a pool-pool log-ratio comparison from the Illumina platform, depicted are the effect and distribution of probe GC content. Top: Showing the effect of GC content on log-ratio. Bottom: Showing the distribution of probe GC content.
Figure 17
Figure 17
For a pool-pool hybridization from the Nimblegen platform depicted are the effect and distribution of probe GC content. Top: Showing the effect of GC content on log-ratio. Bottom: Showing the distribution of probe GC content. The median GC content is 0.42 (IQR 0.38 to 0.44), but is noticeably lower for chromosomes 4 and 13, and noticeably higher for chromosomes 19 and 22. Naturally there is a high spatial auotcorrelation of probe GC content along the genome.

Similar articles

Cited by

References

    1. Redon R, Ishikawa S, Fitch KR, Feuk L, Perry GH, Andrews TD, Fiegler H, Shapero MH, Carson AR, Chen W. Global variation in copy number in the human genome. Nature. 2006;444(7118):444–454. doi: 10.1038/nature05329. - DOI - PMC - PubMed
    1. Schmutz J, Martin J, Terry A, Couronne O, Grimwood J, Lowry S, Gordon LA, Scott D, Xie G, Huang W. The DNA sequence and comparative analysis of human chromosome 5. Nature. 2004;431(7006):268–274. doi: 10.1038/nature02919. - DOI - PubMed
    1. Comprehensive genomic characterization defines human glioblastoma genes and core pathways. Nature. 2008;455(7216):1061–1068. doi: 10.1038/nature07385. - DOI - PMC - PubMed
    1. Gaasenbeek M, Howarth K, Rowan AJ, Gorman PA, Jones A, Chaplin T, Liu Y, Bicknell D, Davison EJ, Fiegler H. Combined array-comparative genomic hybridization and single-nucleotide polymorphism-loss of heterozygosity analysis reveals complex changes and multiple forms of chromosomal instability in colorectal cancers. Cancer Res. 2006;66(7):3471–3479. doi: 10.1158/0008-5472.CAN-05-3285. - DOI - PubMed
    1. Greshock J, Feng B, Nogueira C, Ivanova E, Perna I, Nathanson K, Protopopov A, Weber BL, Chin L. A comparison of DNA copy number profiling platforms. Cancer Res. 2007;67(21):10173–10180. doi: 10.1158/0008-5472.CAN-07-2102. - DOI - PubMed

Publication types