

Codon usage is associated with the evolutionary age of genes in metazoan genomes
- PMID: 19995431
- PMCID: PMC2799417
- DOI: 10.1186/1471-2148-9-285
Codon usage is associated with the evolutionary age of genes in metazoan genomes
Abstract
Background: Codon usage may vary significantly between different organisms and between genes within the same organism. Several evolutionary processes have been postulated to be the predominant determinants of codon usage: selection, mutation, and genetic drift. However, the relative contribution of each of these factors in different species remains debatable. The availability of complete genomes for tens of multicellular organisms provides an opportunity to inspect the relationship between codon usage and the evolutionary age of genes.
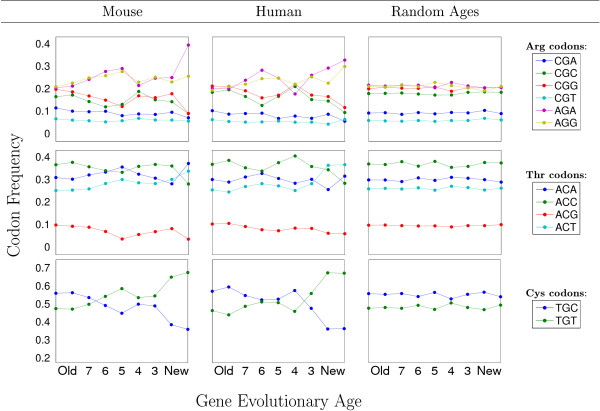
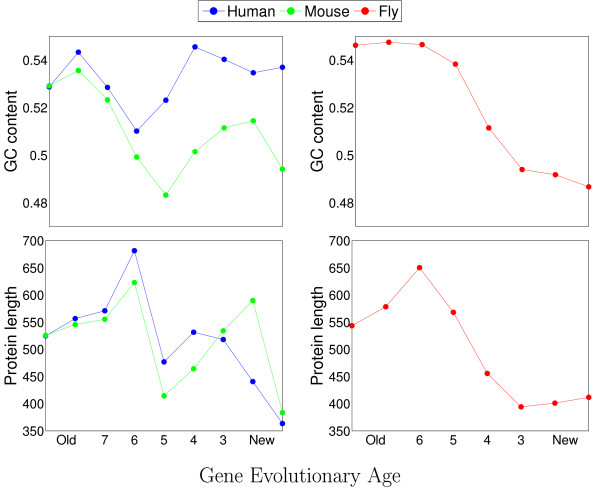
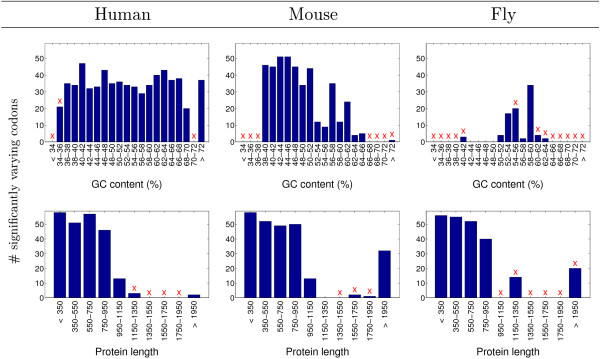
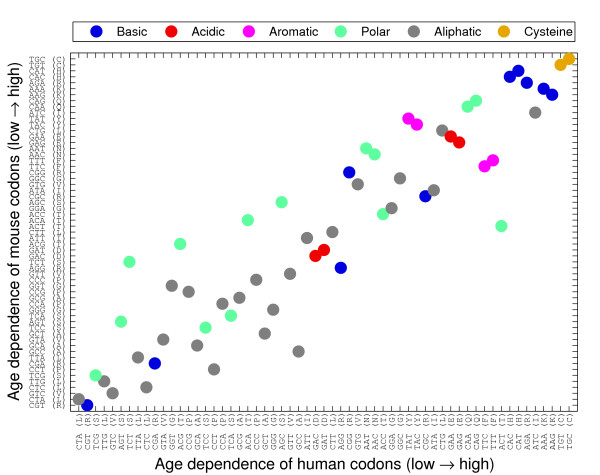
Results: We assign an evolutionary age to a gene based on the relative positions of its identified homologues in a standard phylogenetic tree. This yields a classification of all genes in a genome to several evolutionary age classes. The present study starts from the observation that each age class of genes has a unique codon usage and proceeds to provide a quantitative analysis of the codon usage in these classes. This observation is made for the genomes of Homo sapiens, Mus musculus, and Drosophila melanogaster. It is even more remarkable that the differences between codon usages in different age groups exhibit similar and consistent behavior in various organisms. While we find that GC content and gene length are also associated with the evolutionary age of genes, they can provide only a partial explanation for the observed codon usage.
Conclusion: While factors such as GC content, mutational bias, and selection shape the codon usage in a genome, the evolutionary history of an organism over hundreds of millions of years is an overlooked property that is strongly linked to GC content, protein length, and, even more significantly, to the codon usage of metazoan genomes.
Figures

Similar articles
-
Codon usage in twelve species of Drosophila.BMC Evol Biol. 2007 Nov 15;7:226. doi: 10.1186/1471-2148-7-226. BMC Evol Biol. 2007. PMID: 18005411 Free PMC article.
-
A simple model based on mutation and selection explains trends in codon and amino-acid usage and GC composition within and across genomes.Genome Biol. 2001;2(4):RESEARCH0010. doi: 10.1186/gb-2001-2-4-research0010. Epub 2001 Mar 22. Genome Biol. 2001. PMID: 11305938 Free PMC article.
-
Comparative analysis of the base composition and codon usages in fourteen mycobacteriophage genomes.J Biomol Struct Dyn. 2005 Aug;23(1):63-71. doi: 10.1080/07391102.2005.10507047. J Biomol Struct Dyn. 2005. PMID: 15918677
-
Codon usage bias: causative factors, quantification methods and genome-wide patterns: with emphasis on insect genomes.Biol Rev Camb Philos Soc. 2013 Feb;88(1):49-61. doi: 10.1111/j.1469-185X.2012.00242.x. Epub 2012 Aug 14. Biol Rev Camb Philos Soc. 2013. PMID: 22889422 Review.
-
DNA sequence evolution: the sounds of silence.Philos Trans R Soc Lond B Biol Sci. 1995 Sep 29;349(1329):241-7. doi: 10.1098/rstb.1995.0108. Philos Trans R Soc Lond B Biol Sci. 1995. PMID: 8577834 Review.
Cited by
-
Codon usage patterns across seven Rosales species.BMC Plant Biol. 2022 Feb 5;22(1):65. doi: 10.1186/s12870-022-03450-x. BMC Plant Biol. 2022. PMID: 35123393 Free PMC article.
-
Toward Reducing Phylostratigraphic Errors and Biases.Genome Biol Evol. 2018 Aug 1;10(8):2037-2048. doi: 10.1093/gbe/evy161. Genome Biol Evol. 2018. PMID: 30060201 Free PMC article.
-
A two-level model for the role of complex and young genes in the formation of organism complexity and new insights into the relationship between evolution and development.Evodevo. 2018 Nov 12;9:22. doi: 10.1186/s13227-018-0111-4. eCollection 2018. Evodevo. 2018. PMID: 30455862 Free PMC article.
-
Compositional properties and codon usage pattern of mitochondrial ATP gene in different classes of Arthropoda.Genetica. 2019 Aug;147(3-4):231-248. doi: 10.1007/s10709-019-00067-1. Epub 2019 May 31. Genetica. 2019. PMID: 31152294
-
Phytophthora megakarya and P. palmivora, closely related causal agents of cacao black pod rot, underwent increases in genome sizes and gene numbers by different mechanisms.Genome Biol Evol. 2017 Feb 10;9(3):536-57. doi: 10.1093/gbe/evx021. Online ahead of print. Genome Biol Evol. 2017. PMID: 28186564 Free PMC article.
References
Publication types
MeSH terms
Substances
LinkOut - more resources
Full Text Sources
Molecular Biology Databases
Miscellaneous
