

Genomic microsatellites identify shared Jewish ancestry intermediate between Middle Eastern and European populations
- PMID: 19995433
- PMCID: PMC2797531
- DOI: 10.1186/1471-2156-10-80
Genomic microsatellites identify shared Jewish ancestry intermediate between Middle Eastern and European populations
Abstract
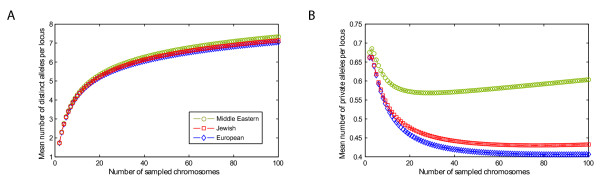
Background: Genetic studies have often produced conflicting results on the question of whether distant Jewish populations in different geographic locations share greater genetic similarity to each other or instead, to nearby non-Jewish populations. We perform a genome-wide population-genetic study of Jewish populations, analyzing 678 autosomal microsatellite loci in 78 individuals from four Jewish groups together with similar data on 321 individuals from 12 non-Jewish Middle Eastern and European populations.
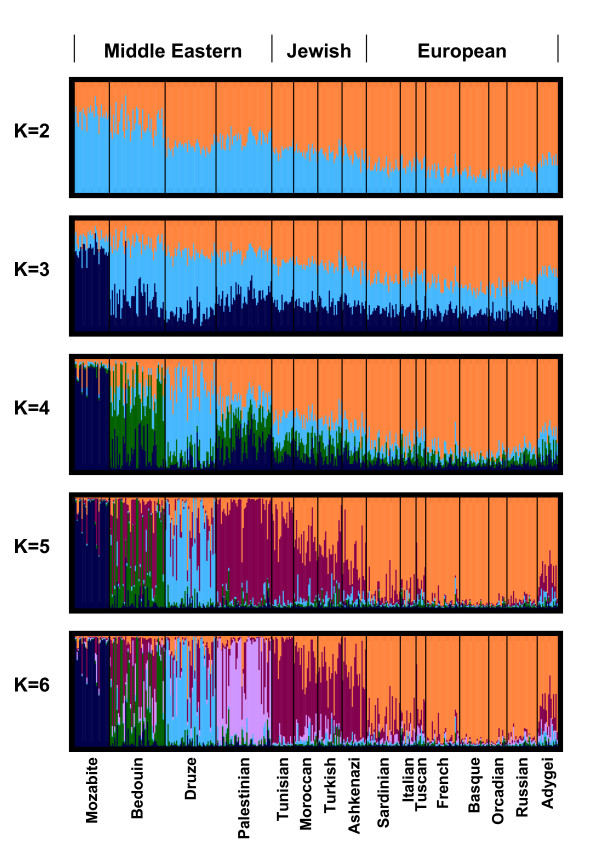
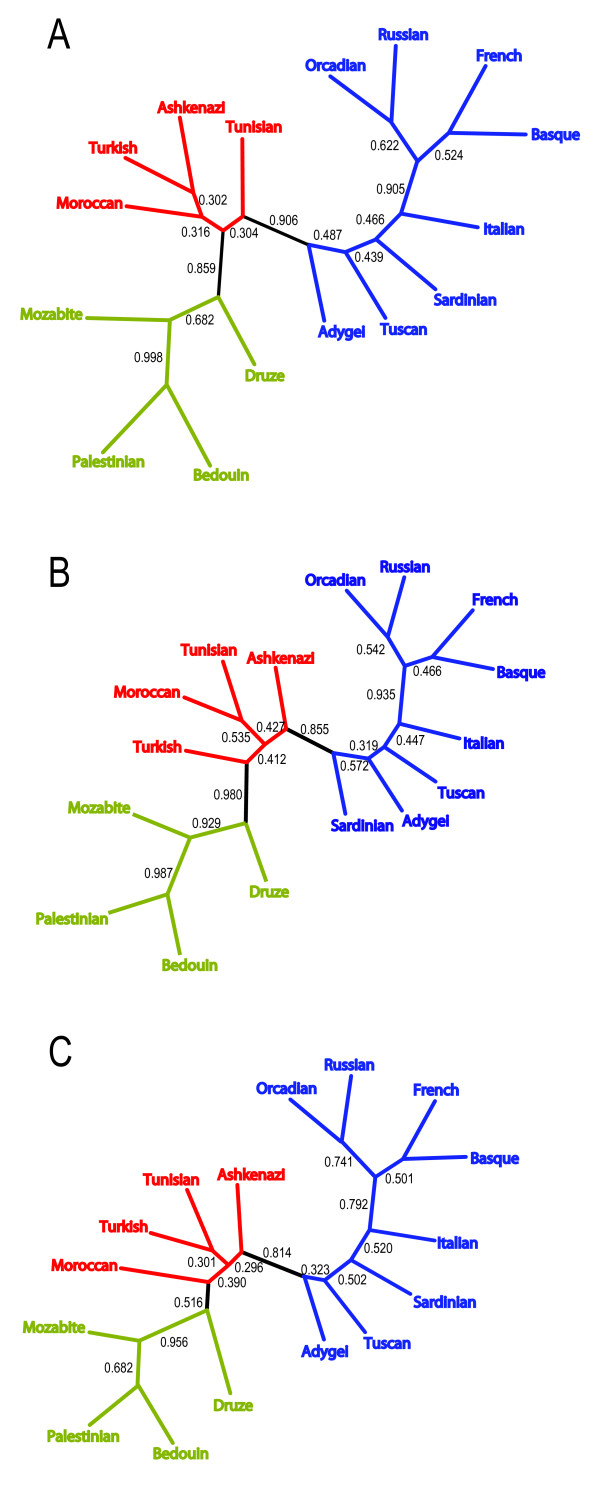
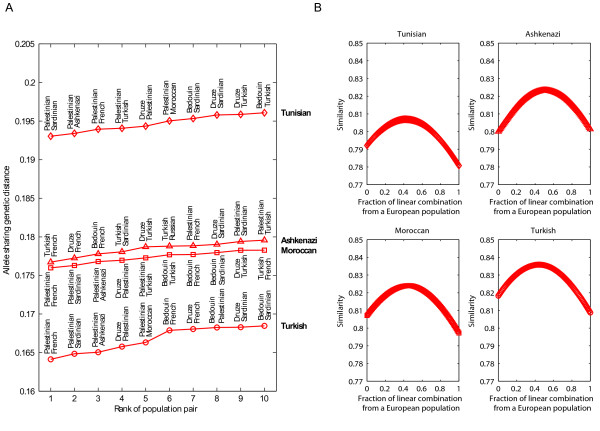
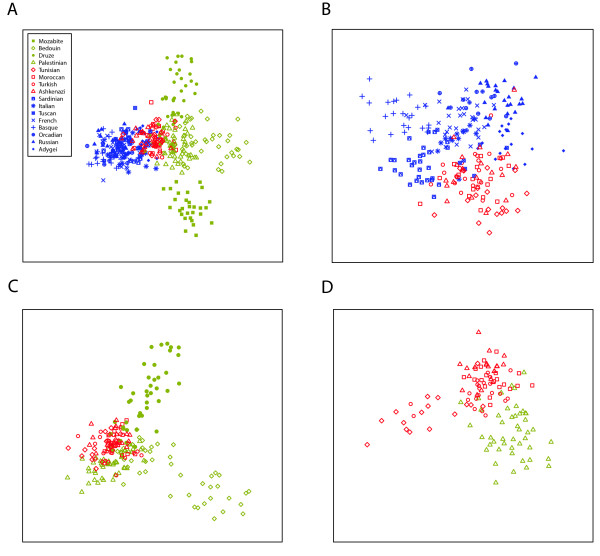
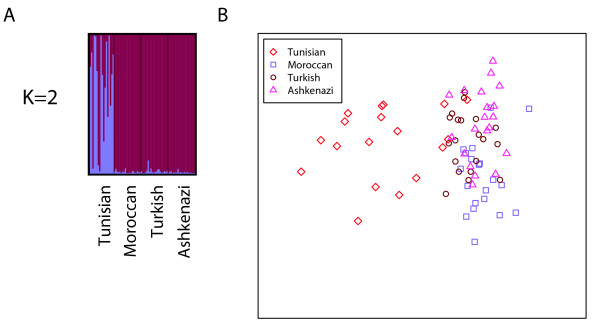
Results: We find that the Jewish populations show a high level of genetic similarity to each other, clustering together in several types of analysis of population structure. Further, Bayesian clustering, neighbor-joining trees, and multidimensional scaling place the Jewish populations as intermediate between the non-Jewish Middle Eastern and European populations.
Conclusion: These results support the view that the Jewish populations largely share a common Middle Eastern ancestry and that over their history they have undergone varying degrees of admixture with non-Jewish populations of European descent.
Figures
Similar articles
-
The genome-wide structure of the Jewish people.Nature. 2010 Jul 8;466(7303):238-42. doi: 10.1038/nature09103. Epub 2010 Jun 9. Nature. 2010. PMID: 20531471
-
No evidence from genome-wide data of a Khazar origin for the Ashkenazi Jews.Hum Biol. 2013 Dec;85(6):859-900. doi: 10.3378/027.085.0604. Hum Biol. 2013. PMID: 25079123
-
Abraham's children in the genome era: major Jewish diaspora populations comprise distinct genetic clusters with shared Middle Eastern Ancestry.Am J Hum Genet. 2010 Jun 11;86(6):850-9. doi: 10.1016/j.ajhg.2010.04.015. Am J Hum Genet. 2010. PMID: 20560205 Free PMC article.
-
The population genetics of the Jewish people.Hum Genet. 2013 Feb;132(2):119-27. doi: 10.1007/s00439-012-1235-6. Epub 2012 Oct 10. Hum Genet. 2013. PMID: 23052947 Free PMC article. Review.
-
A genetic profile of contemporary Jewish populations.Nat Rev Genet. 2001 Nov;2(11):891-8. doi: 10.1038/35098506. Nat Rev Genet. 2001. PMID: 11715044 Review.
Cited by
-
The genome-wide structure of the Jewish people.Nature. 2010 Jul 8;466(7303):238-42. doi: 10.1038/nature09103. Epub 2010 Jun 9. Nature. 2010. PMID: 20531471
-
Portuguese crypto-Jews: the genetic heritage of a complex history.Front Genet. 2015 Feb 2;6:12. doi: 10.3389/fgene.2015.00012. eCollection 2015. Front Genet. 2015. PMID: 25699075 Free PMC article. Review.
-
The prevalence of refractive errors in college students in Israel.J Optom. 2022 Oct-Dec;15(4):284-292. doi: 10.1016/j.optom.2021.09.001. Epub 2021 Dec 28. J Optom. 2022. PMID: 34969625 Free PMC article.
-
Live birth sex ratios and father's geographic origins in Jerusalem, 1964-1976.Am J Hum Biol. 2017 May 6;29(3):10.1002/ajhb.22945. doi: 10.1002/ajhb.22945. Epub 2016 Nov 30. Am J Hum Biol. 2017. PMID: 27901293 Free PMC article.
-
Population structure in nontypeable Haemophilus influenzae.Infect Genet Evol. 2013 Mar;14:125-36. doi: 10.1016/j.meegid.2012.11.023. Epub 2012 Dec 22. Infect Genet Evol. 2013. PMID: 23266487 Free PMC article.
