Review
. 2011 Nov;20(4):108-20.
doi: 10.1016/j.jtv.2009.11.004. Epub 2009 Dec 7.

Fibroblasts and myofibroblasts in wound healing: force generation and measurement

Affiliations
Review

Fibroblasts and myofibroblasts in wound healing: force generation and measurement

Bin Li et al. J Tissue Viability. 2011 Nov.

Abstract

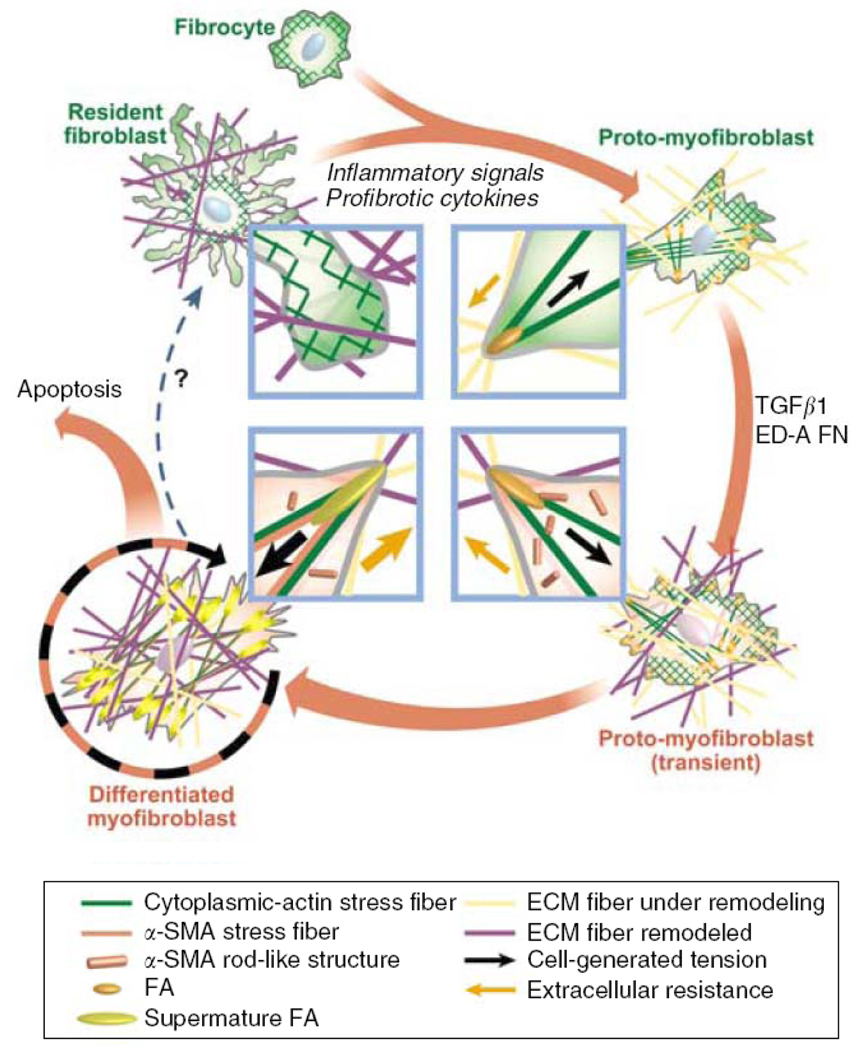
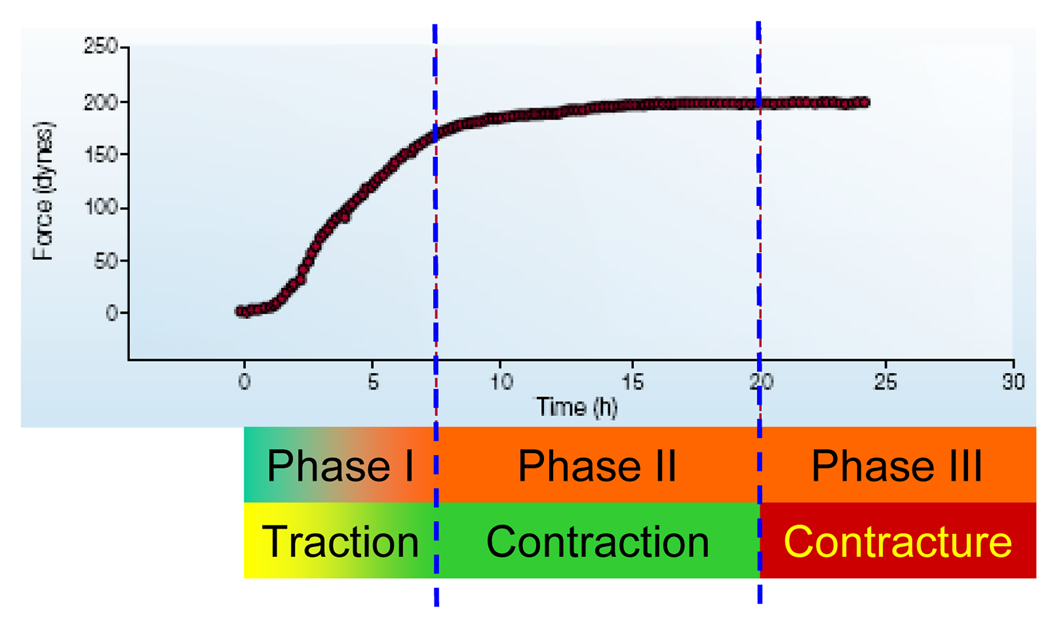
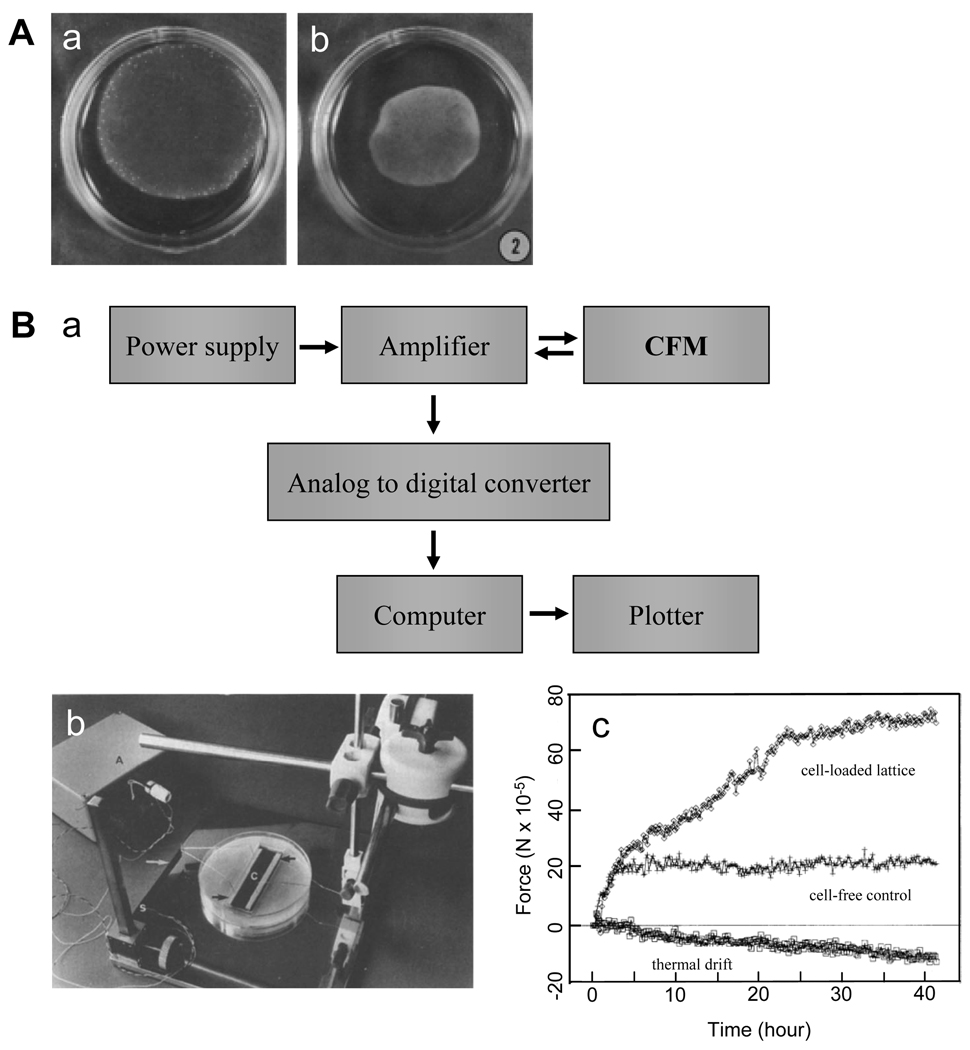
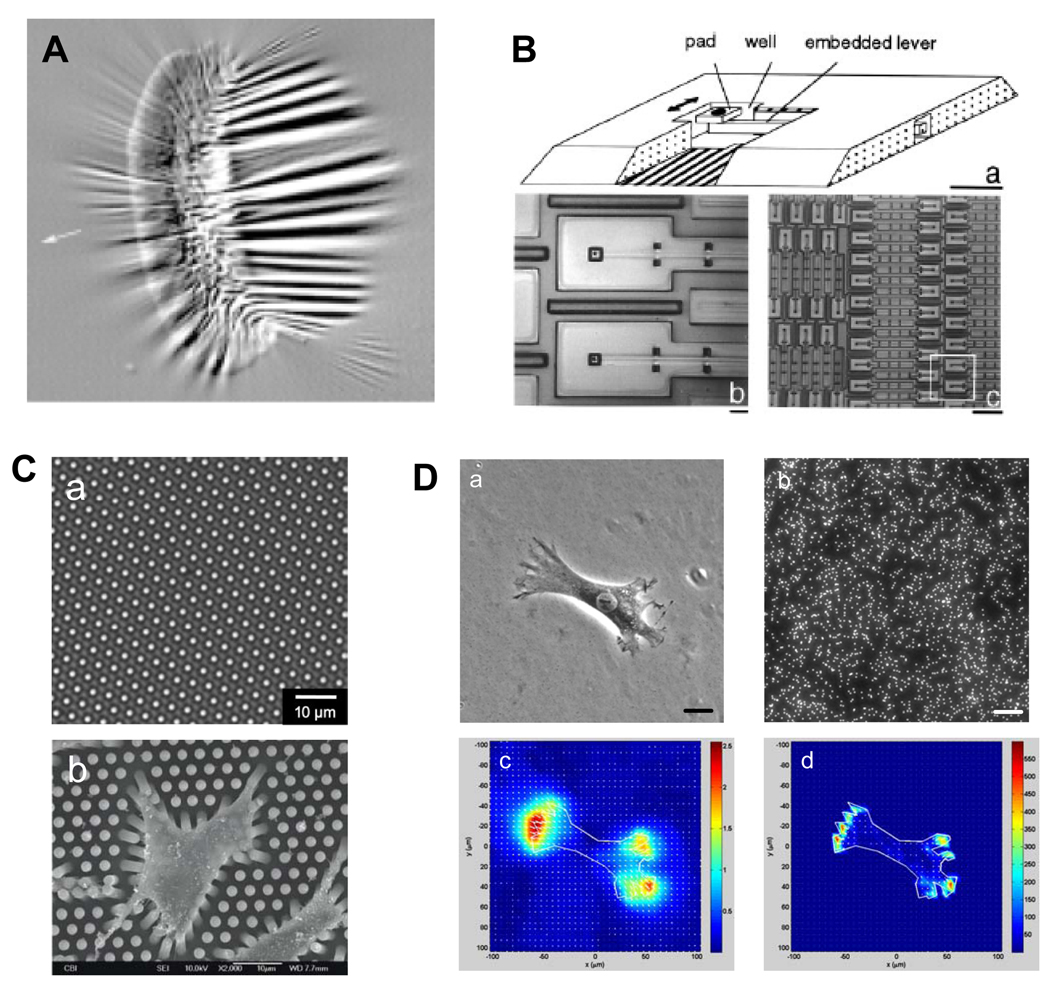
Fibroblasts are one of the most abundant cell types in connective tissues. These cells are responsible for tissue homeostasis under normal physiological conditions. When tissues are injured, fibroblasts become activated and differentiate into myofibroblasts, which generate large contractions and actively produce extracellular matrix (ECM) proteins to facilitate wound closure. Both fibroblasts and myofibroblasts play a critical role in wound healing by generating traction and contractile forces, respectively, to enhance wound contraction. This review focuses on the mechanisms of force generation in fibroblasts and myofibroblasts and techniques for measuring such cellular forces. Such a topic was chosen specifically because of the dual effects that fibroblasts/myofibroblasts have in wound healing process- a suitable amount of force generation and matrix deposition is beneficial for wound healing; excessive force and matrix production, however, result in tissue scarring and even malfunction of repaired tissues. Therefore, understanding how forces are generated in these cells and knowing exactly how much force they produce may guide the development of optimal protocols for more effective treatment of tissue wounds in clinical settings.


Figures

Figure 1
Figure 1
Schematic illustration of the mechanical feedback loop in myofibroblast development. Fibroblasts in intact tissue are stress-shielded by ECM and do not develop contractile features and cell–matrix adhesions. Upon injury, inflammatory signals activate fibroblasts to spread into the provisional wound matrix and become proto-myofibroblasts. TGF-β1 stimulates proto-myofibroblasts to express α-SMA and become differentiated myofibroblasts. Myofibroblasts may exit this cycle when ECM is reconstituted and takes over the mechanical load; stress-released myofibroblasts eventually undergo apoptosis. (Reproduced with permission from Fig. 3 in Hinz, J Invest Dermatol 127: 526, 2007).
Figure 2
Figure 2
A three-phase healing process in a three-dimensional collagen lattice model. In phase I, fibroblasts exert traction forces to the matrix and cause slow compaction of the collagen lattice and as a result, mechanical stresses start to develop within the lattice, inducing transformation of fibroblasts into pro-myofibroblasts. Traction force increases almost linearly as a result of fibroblasts exerting forces on the matrix. In phase II, pro-myofibroblasts become further differentiated into myofibroblasts in the presence of TGF-β1. Cells generate contractile forces and eventually keep the forces at a constant level until remodeling is completed. If this process continues and myofibroblasts do not progressively disappear, healing activity becomes excessive and enters phase III, during which detrimental contracture occurs. (Adapted with permission from Fig. 3 in Tomasek et al., Nat Rev Mol Cell Biol 3: 349, 2002).
Figure 3
Figure 3
Fibroblast-populated collagen lattice (FPCL) based cell contraction measurements. (A). A free-floating fibroblast-populated collagen lattice (FF-FPCL) for estimating fibroblast contraction. a and b show the lattice upon cell loading and after 48 hours in culture, respectively. Measuring the reduction in the geometric features of collagen lattice provides indirect quantification of the contractility of these cells. (Adapted with permission from Fig. 2 in Ehrlich and Rajaratnam, Tissue Cell 22: 407, 1990). (B). a, flow chart of a culture force monitor (CFM). b, a picture of a CFM setup. c. a typical CFM measurement. Three curves are shown, including thermal drift from the system, cell-free collagen gel response, and gross force produced by 5.5 × 10⁶ cells in a lattice. (Adapted with permission from Fig. 1–3 in Eastwood et al., Biochim Biophys Acta 1201: 186, 1994).
Figure 4
Figure 4
Techniques for measuring traction forces of single cells. (A). A cell produces wrinkles on a silicone membrane. (Reproduced with permission from Fig. 1 in Beningo and Wang, Trends Cell Biol 12: 79, 2002). (B). Different magnifications of a micromachined device for cell traction force measurement. (Adapted with permission from Fig. 1 in Galbraith and Sheetz, Proc Natl Acad Sci USA 94: 9114, 1997). (C). A micropost force sensor array. a, phase contrast microscopy image of MFSA. b, SEM image of rat aorta SMCs adhering to the top of MFSA. (Adapted with permission from Fig. 5 and 6 in Li et al., Cell Motil Cytoskeleton 64: 509, 2007). (D). Cell traction force microscopy (CTFM). a, a human patellar tendon fibroblast (HPTF) on a polyacrylamide gel; b, fluorescence image of fluorescent beads embedded in gel; c, substrate displacement field; and d, cell traction force field. Scale bars, 20 µm. (Adapted with permission from Fig. 1 in Chen et al., Cell Motility & Cytoskeleton 64: 248, 2007).
Figure 5
Figure 5
CTFM for micropatterned cells. (A). Application of CTFM to determine traction forces of micropatterned cells. Immunofluorescence microscopy images of F-actin, vinculin, and their overlay, as well as CTFs in micropatterned HPTFs. a, rectangular HPTF; b, circular HTF. Development of focal adhesions and stress fibers is seen to be closely related to cell traction force distribution. Scale bars, 20 µm. (Adapted with permission from Fig. 6 in Li et al., Cell Motil Cytoskeleton 65: 332, 2008). (B). Traction force development of micropatterned C2C12 cells during differentiation. Phase contrast images (left panel) and corresponding traction force maps (right panel), respectively. The color bar represents traction force level. Scale bars, 50 µm. (Reproduced with permission from Fig. 5 in Li et al., J Biomech 41: 3349, 2008). (C). Mechanical stress distribution of patterned cell aggregates. a–c, micropatterned cell islands of distinctive shapes. d–f. CTF distribution of cell islands determined by CTFM. Scale bars, 100 µm. (Adapted with permission from Fig. 2 in Li et al., J Biomech 42: 1622, 2009).

References

    1. Tomasek JJ, Gabbiani G, Hinz B, Chaponnier C, Brown RA. Nat Rev Mol Cell Biol. 2002;3:349–363. - PubMed
    1. Kozma EM, Olczyk K, Bobinski R, Kasperczyk M, Szpyra K. Chir Narzadow Ruchu Ortop Pol. 2002;67:73–79. - PubMed
    1. Hinz B. J Invest Dermatol. 2007;127:526–537. - PubMed
    1. Hinz B, Phan SH, Thannickal VJ, Galli A, Bochaton-Piallat ML, Gabbiani G. Am J Pathol. 2007;170:1807–1816. - PMC - PubMed
    1. Powell DW, Mifflin RC, Valentich JD, Crowe SE, Saada JI, West AB. Am J Physiol. 1999;277:C1–C9. - PubMed