. 2010 Feb;30(3):781-92.
doi: 10.1128/MCB.00330-09. Epub 2009 Dec 7.

SRC-mediated phosphorylation of dynamin and cortactin regulates the "constitutive" endocytosis of transferrin

Affiliations

SRC-mediated phosphorylation of dynamin and cortactin regulates the "constitutive" endocytosis of transferrin

Hong Cao et al. Mol Cell Biol. 2010 Feb.

Abstract

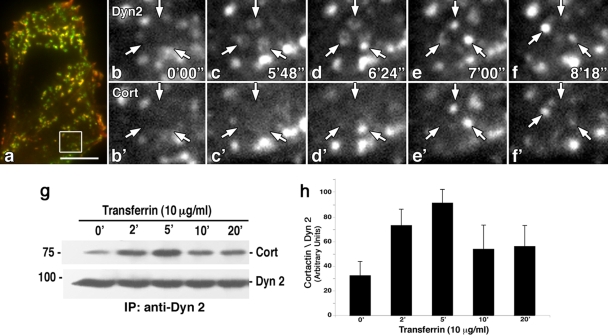
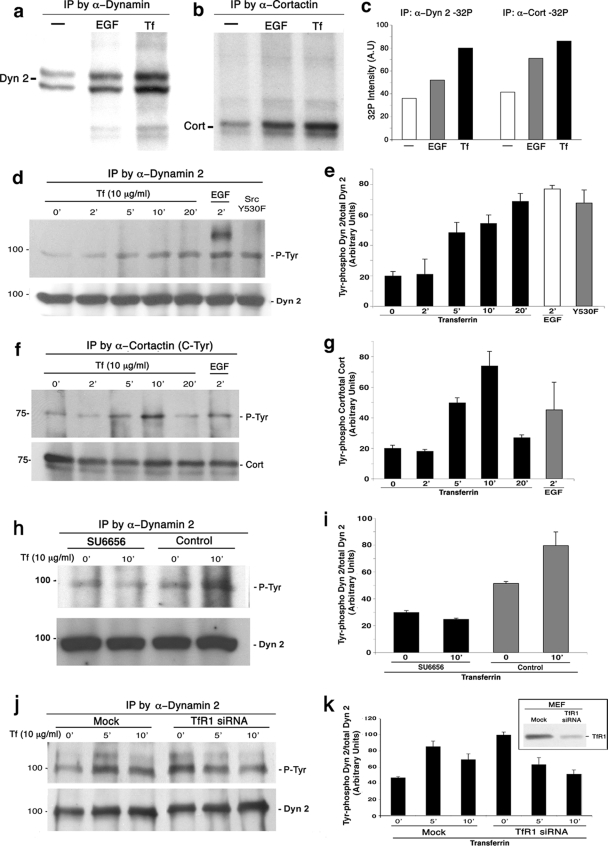
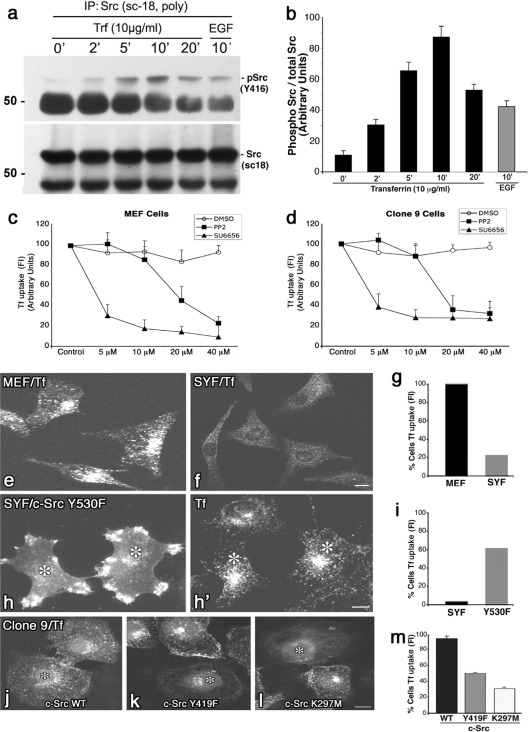
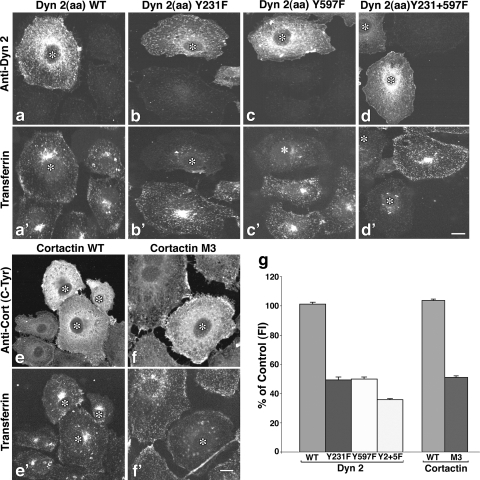
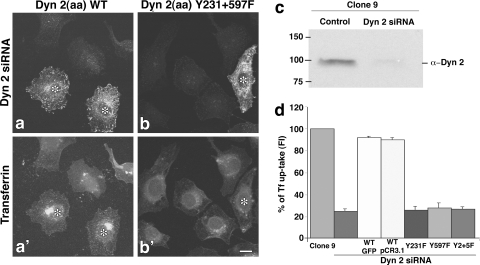
The mechanisms by which epithelial cells regulate clathrin-mediated endocytosis (CME) of transferrin are poorly defined and generally viewed as a constitutive process that occurs continuously without regulatory constraints. In this study, we demonstrate for the first time that endocytosis of the transferrin receptor is a regulated process that requires activated Src kinase and, subsequently, phosphorylation of two important components of the endocytic machinery, namely, the large GTPase dynamin 2 (Dyn2) and its associated actin-binding protein, cortactin (Cort). To our knowledge these findings are among the first to implicate an Src-mediated endocytic cascade in what was previously presumed to be a nonregulated internalization process.


Figures

FIG. 1.
FIG. 1.
Dyn2 and Cort are recruited sequentially to clathrin-coated pits in response to Tf addition. (a to f′) TIRF microscopy of live rat fibroblasts coexpressing Dyn2-GFP and Cort-RFP. (a) Low-magnification color image showing overlap of Dyn2-GFP and Cort-RFP in yellow. (b to f′) Higher-magnification images of select regions from the cells in panel a show numerous rings of Dyn2-GFP (arrows) that appear along the cell base. With no ligand added (time zero) (b and b′), no rings are present, but upon Tf addition, these rings appear, condense, and vesiculate prior to liberation from the PM (b to f). Cort-RFP is recruited to the Dyn2 ring structures just prior to the release of the Dyn2-GFP positive vesicle (arrows) (b′ to f′). Bar = 10 μm. (g) IP of Dyn2 from Tf-stimulated cultured cells shows an induced interaction with Cort. (h) Densitometric quantitation of three independent experiments as shown in panel g comparing the ratio of Cort to Dyn2 showing a 3-fold increase in association of Dyn2 and Cort by just 5 min following Tf addition. Results represent the average ± SE of three independent experiments.
FIG. 2.
FIG. 2.
Addition of Tf induces rapid TfR1 internalization from the cell surface. (a to c) IF staining of MEF cells incubated in low-serum media and stained with an antibody to the extracellular domain of the TfR1. Cells fixed and stained after 0, 5, and 20 min following addition of 10 μg/ml Tf showed a markedly reduced surface staining (b and c). (d) Quantitative microscopy analysis of total cell fluorescence showing a 30 to 40% reduction in surface TfR1 following ligand addition at 2, 5, 10, 15, and 20 min post-ligand addition. Results represent the average ± SE of >60 cells measured in each of three independent experiments. (e) WB analysis of surface biotinylation assay results showing a reduction of the TfR1 levels at the PM following addition of Tf ligand. (f) Densitometric quantitation of the results for 3 independent experiments represented in panel e comparing the ratio of biotinylated TfR1 to total TfR1. A similar clearance of the TfR1 from the surface at 10 min post-ligand addition is observed in both IF and biochemical assays. α, anti; bar = 10 μm.
FIG. 3.
FIG. 3.
Tf addition stimulates an increase in vesicle budding from the PM. (a) A low-magnification TIRF microscopy image of living Clone 9 cells expressing Dyn2-GFP. A series of higher-magnification images of the boxed region in panel a are shown in panels b to d. Cells in the absence of Tf showed little, if any, Dyn2-GFP-based vesicle budding over the 10- to 20-min observation time (b). In contrast, addition of Tf (5 μg/ml) induced the formation of Dyn2 vesicles from the PM that continued over a 20-min time period (c and d). Statistical counts of this observed Dyn2-GFP vesicle formation within 10-μm by 10-μm boxes of 5 different cells viewed 10 min before and 10 min following Tf addition showed a >40% increase in Dyn2 vesicle formation subsequent to ligand addition. Bar = 10 μm. (e) IP of the TfR1 from MEFs showing an increase in associated Dyn2 and Cort minutes following Tf addition. (f and g) Densitometric quantitation of 3 independent experiments similar to that shown in panel e comparing the ratio of Dyn2 and Cort to TfR1. Results represent the average ± SE of 3 independent experiments.
FIG. 4.
FIG. 4.
Dyn2 and Cort are tyrosine phosphorylated after Tf stimulation. Addition of Tf to cultured cells induces substantial phosphorylation of both Dyn2 and Cort. (a and b) Autoradiographs of Dyn2 or Cort precipitated from Clone 9 cells following incubation for 16 h in 0.2% BSA in PDM, including 32P for 2 h without stimulation or 5 min in 30 ng/ml of EGF, or 5 μg/ml Tf. (c) Quantitative scanning of the precipitated proteins revealed a 2- to 3-fold increase in phosphorylation following stimulation with Tf compared to resting cells. (d and f) MEF cells were stimulated with either Tf or EGF or expressed active c-Src Y530F protein as a positive control, at the indicated time points. Dyn2 (d) or Cort (f) was precipitated from cell lysates and analyzed by WB analysis for phosphotyrosine (pY20 antibody) and the precipitated protein. (e and g) Densitometric quantitation of the phosphotyrosine bands from 3 independent experiments, similar to those shown in panels d and f and normalized to the total levels of the respective protein. Tyrosine phosphorylation of both Dyn2 and Cort increases significantly (4- to 5-fold) following addition of Tf, compared to resting cells. This increase in tyrosine phosphorylation is at levels similar to, or even exceeding, that induced by stimulation with EGF. (h and i) The Src kinase inhibitor SU6656 prevents Tf-stimulated phosphorylation of Dyn2. MEF cells were serum starved and then treated with 20 μM SU6656 drug for 2 h prior to, and included with, stimulation with 10 μg/ml Tf for 20 min. Following Tf stimulation, cells were lysed, and Dyn2 was precipitated and analyzed by WB analysis with Y416 antibody. Pretreatment with the SU6656 drug completely prevented the Src-mediated phosphoactivation of Dyn2. Results represent the average ± SE of 3 independent experiments. α, anti.
FIG. 5.
FIG. 5.
Active Src kinase is required for the endocytic uptake of Tf. (a and b) WB analysis and corresponding quantitation of activated Src precipitated from MEFs that were treated with Tf (10 μg/ml) over 0 to 20 min. Ligand addition induced a 7- to 10-fold activation of Src by 5 to 10 min. This activation exceeded that observed by EGF addition and occurs at a time corresponding to endocytic vesicle formation, and an increased physical interaction between the TfR1, Dyn2, and Cort. (c and d) Src inhibitory drugs reduce Tf internalization in MEF or Clone 9 cells. Serum-starved cells were incubated in vehicle alone or various increasing concentrations of PP2 or SU6656 for 2 h prior to addition of 10 μg/ml Alexa-594 Tf for 20 min. Cells were then fixed, and fluorescence was quantitated for Tf internalization. A marked reduction of Tf internalization was observed at low or moderate concentrations of either drug. Data are presented as means ± the standard deviation. (e and f) IF images of MEF control cells (e) or MEFs cultured from SYF−/− mice (f) that were incubated with Alexa-594-labeled Tf at 37°C for 20 min. While the control MEFs internalized substantial amounts of ligand, the SYF−/− cells internalized 80% less (g). Expression of an exogenous, active c-Src (Y530F) in the SYF−/− cells (h) rescued over 60% of the cells to internalize Alexa-594 Tf (h′ and i) compared to the untransfected cells. (j to m) Clone 9 cells that were incubated with Alexa-594-labeled Tf at 37°C for 20 min and then fixed and viewed by IF. Control cells (j) internalized substantially more Tf than did cells expressing inactive forms of c-Src, such as the c-Src Y419F mutant (k) or the c-Src K297M mutant (l) that were reduced by 50% and 70%, respectively (m). Asterisks represent transfected cells. Results represent the averages ± SE of >100 cells measured in each of 3 independent experiments. Bars = 10 μm.
FIG. 6.
FIG. 6.
Tyrosine phosphorylation-defective mutants of Dyn2 and Cort inhibit Tf uptake. (a to f′) Clone 9 cells expressing WT Dyn2 (a) or Cort (e) or mutants in which tyrosine residues previously shown to be sites of c-Src phosphorylation were altered (Dyn2 Y231F [b], Y597F [c], Y231+597F [d], and Cort Y384,429,445F [f] mutants) were incubated with Alexa-594-labeled Tf (a′ to f′) at 37°C for 20 min and analyzed by fluorescence microscopy. Transfected cells (*) were revealed by staining with antibodies against Dyn2 (a to d) or Cort (e and f). (g) As indicated by the images, quantitation of internalized Tf based on fluorescence intensity measurements taken from 3 independent experiments showed that inhibition of either Dyn2 or Cort tyrosine phosphorylation reduced Tf uptake by 50 to 70%. Results represent the average ± SE of >100 cells measured in each of three independent experiments. Bar = 10 μm.
FIG. 7.
FIG. 7.
Effects of Dyn2 tyrosine phosphomutants on Tf uptake in cells depleted of Dyn2. (a to b′) Clone 9 cells depleted of Dyn2 via siRNA and transfected to reexpress WT Dyn2 (a) or a Dyn2 tyrosine point mutant (Dyn2 Y231+597F [b]) were allowed to internalize Alexa-594-labeled Tf at 37°C for 20 min (a′ and b′). Dyn2 was stained (a and b) to detect the reexpressed WT or mutant (*) and analyzed by fluorescence microscopy. (c) WB analysis confirmed that Dyn2 protein levels were reduced by siRNA treatment by 90%. (d) Quantitation of Tf uptake based on fluorescence intensity measurements in control Clone 9 cells and Dyn2 siRNA-treated cells alone or following reexpression of the indicated constructs shows that Dyn2 tyrosine phosphomutants are unable to rescue Tf uptake in cells depleted of endogenous Dyn2. Data are presented as means ± SE. Bar = 10 μm.

Similar articles

Cited by

References

    1. Ahn, S., J. Kim, C. L. Lucaveche, M. C. Reedy, L. M. Luttrell, R. J. Lefkowitz, and Y. Daaka. 2002. Src-dependent tyrosine phosphorylation regulates dynamin self-assembly and ligand-induced endocytosis of the epidermal growth factor receptor. J. Biol. Chem. 277:26642-26651. - PubMed
    1. Ahn, S., S. Maudsley, L. M. Luttrell, R. J. Lefkowitz, and Y. Daaka. 1999. Src-mediated tyrosine phosphorylation of dynamin is required for beta2-adrenergic receptor internalization and mitogen-activated protein kinase signaling. J. Biol. Chem. 274:1185-1188. - PubMed
    1. Andreeva, A. V., M. A. Kutuzov, and T. A. Voyno-Yasenetskaya. 2007. Scaffolding proteins in G-protein signaling. J. Mol. Signal. 2:13. - PMC - PubMed
    1. Behrens, J., L. Vakaet, R. Friis, E. Winterhager, F. Van Roy, M. M. Mareel, and W. Birchmeier. 1993. Loss of epithelial differentiation and gain of invasiveness correlates with tyrosine phosphorylation of the E-cadherin/beta-catenin complex in cells transformed with a temperature-sensitive v-SRC gene. J. Cell Biol. 120:757-766. - PMC - PubMed
    1. Beutler, E., A. V. Hoffbrand, and J. D. Cook. 2003. Iron deficiency and overload. Hematology Am. Soc Hematol. Educ. Program 2003:40-61. - PubMed

Publication types