. 2009 Dec 21;206(13):3143-56.
doi: 10.1084/jem.20091333. Epub 2009 Dec 7.

MGL1 promotes adipose tissue inflammation and insulin resistance by regulating 7/4hi monocytes in obesity

Affiliations

MGL1 promotes adipose tissue inflammation and insulin resistance by regulating 7/4hi monocytes in obesity

Daniel J Westcott et al. J Exp Med. .

Abstract

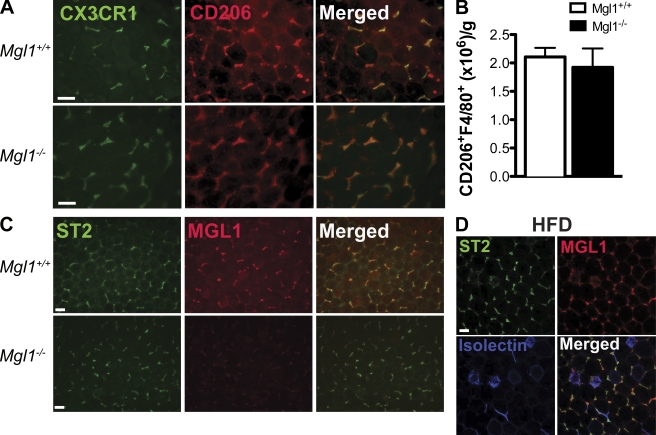
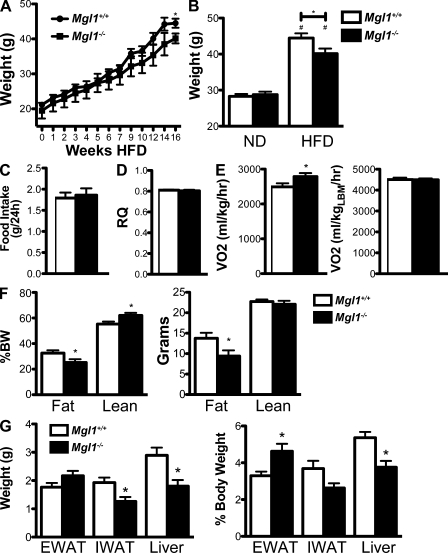
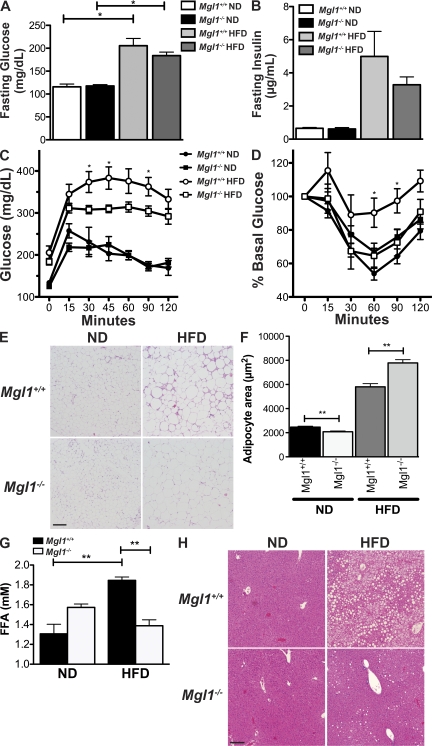
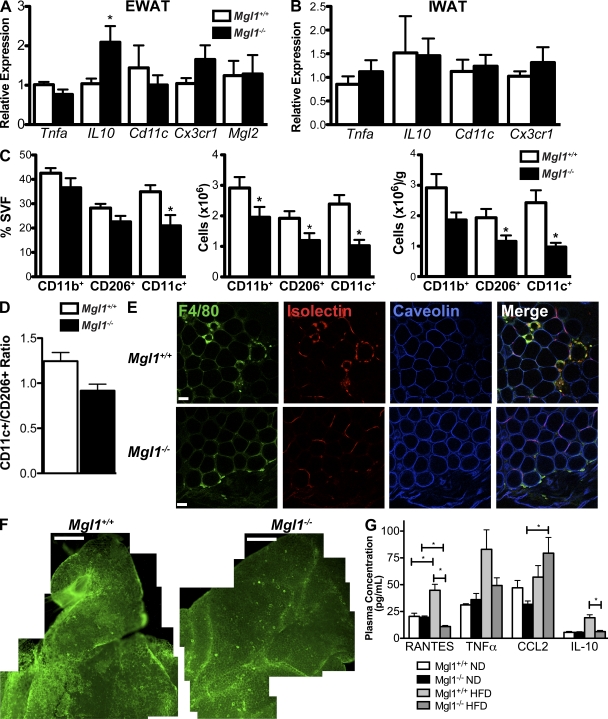
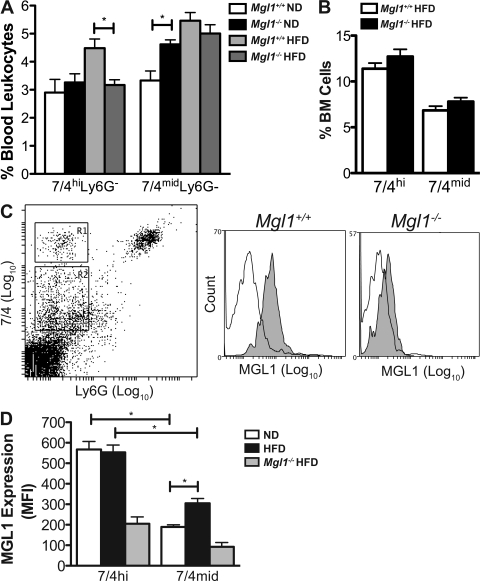
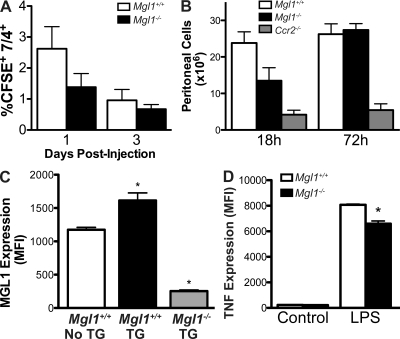
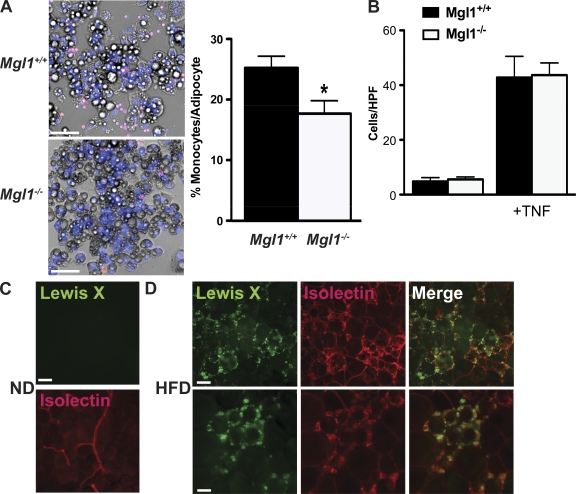
Adipose tissue macrophages (ATMs) play a critical role in obesity-induced inflammation and insulin resistance. Distinct subtypes of ATMs have been identified that differentially express macrophage galactose-type C-type lectin 1 (MGL1/CD301), a marker of alternatively activated macrophages. To evaluate if MGL1 is required for the anti-inflammatory function of resident (type 2) MGL1(+) ATMs, we examined the effects of diet-induced obesity (DIO) on inflammation and metabolism in Mgl1(-/-) mice. We found that Mgl1 is not required for the trafficking of type 2 ATMs to adipose tissue. Surprisingly, obese Mgl1(-/-) mice were protected from glucose intolerance, insulin resistance, and steatosis despite having more visceral fat. This protection was caused by a significant decrease in inflammatory (type 1) CD11c(+) ATMs in the visceral adipose tissue of Mgl1(-/-) mice. MGL1 was expressed specifically in 7/4(hi) inflammatory monocytes in the blood and obese Mgl1(-/-) mice had lower levels of 7/4(hi) monocytes. Mgl1(-/-) monocytes had decreased half-life after adoptive transfer and demonstrated decreased adhesion to adipocytes indicating a role for MGL1 in the regulation of monocyte function. This study identifies MGL1 as a novel regulator of inflammatory monocyte trafficking to adipose tissue in response to DIO.


Figures

Figure 1.
Figure 1.
Type 2 ATMs are unchanged in lean Mgl1−/− mice. (A) Analysis of ATMs in lean mice for markers of alternative activation. Epididymal white adipose tissue (EWAT) from lean Mgl1−/− and Mgl1+/+ mice were stained for CD206 and CX3CR1. (B) Quantitation of F4/80+ CD206+ ATMs in lean Mgl1−/− and Mgl1+/+ mice. SVF isolated from EWAT (n = 4) and analyzed by flow cytometry. Total ATM numbers were normalized to tissue mass. (C) ST2 expression in type 2 resident ATMs. EWAT from ND-fed Mgl1−/− and control C57BL/6 mice were stained for ST2 (green) and MGL1 (red). Staining and imaging parameters were identical between samples to demonstrate the specificity of the antibodies for MGL1. (D) ST2 expression in obese mice. Isolectin staining identifies CLSs containing type 1 ATM clusters. Samples from EWAT from HFD-fed C57BL/6 mice. (A, C, and D) Representative images shown from one of at least three independent experiments. Bars, 50 µm.
Figure 2.
Figure 2.
Effect of DIO on Mgl1−/− mice. (A) Weight gain in HFD-fed Mgl1−/− and control mice. Mice fed a diet of 60% kcal from fat. *, P < 0.05. n = 6 per genotype. (B) Total body weights of ND and HFD-fed mice. *, P = 0.049; #, P < 0.0001 versus ND. n = 10 mice per group. (C–F) Metabolic parameters of HFD-fed mice. *, P < 0.05. n = 6 per group. CLAMS unit used to measure food intake (C), respiratory quotient (D), and oxygen consumption (E) in HFD-fed mice. VO2 data shown with and without normalization for lean body weight (LBW). (F) Body composition analysis of HFD-fed mice measured with MRI and corrected for body weight. (G) Tissue weights in HFD-fed mice. Tissue weight with and without normalization to total body weight is presented. *, P < 0.05 versus WT. n = 9 mice per genotype. Results combined from 2 independent sets of animals.
Figure 3.
Figure 3.
Mgl1−/− mice are protected from DIO-induced insulin resistance. Fasting glucose levels (A) and insulin levels (B). *, P < 0.05. n = 9–12 per group. (C) Glucose tolerance test. Glucose levels were measured after i.p. injection of 0.7 g/kg glucose. *, P < 0.05 versus Mgl1+/+. n = 10 per group from two independent experiments. (D) Insulin tolerance test. Glucose levels were measured after i.p. injection of 1 U/kg insulin. *, P < 0.05 versus Mgl1+/+. n = 6 per group from two independent experiments. (E) Hematoxylin and eosin (H&E)–stained sections from epididymal adipose tissue from mice. Representative images shown. Similar results seen in four independent samples. (F) Adipocyte sizing from visceral adipose tissue. Adipocyte cross-sectional area was assessed on H&E sections by analysis of 150 adipocytes per mouse from 3 separate sections and 3–4 mice per group. **, P < 0.0001. (G) FFA levels. Fasting serum was collected and analyzed for nonesterified FFA levels. **, P < 0.0001. n = 6–8 mice per group. (H) H&E-stained sections from liver biopsies from mice. Representative images shown. Similar results seen in four independent samples.
Figure 4.
Figure 4.
Mgl1−/− mice have fewer type 1 CD11c+ ATMs and decreased adipose tissue inflammation with DIO. (A and B) Expression analysis of inflammatory genes in adipose tissue from HFD-fed Mgl1−/− and WT mice. Samples from epididymal (EWAT; A) and inguinal (IWAT; B) fat analyzed by real-time quantitative RT-PCR. *, P < 0.05 versus Mgl1+/+. n = 4 per group. (C) ATM content assessed by flow cytometry in HFD-fed Mgl1−/− and WT mice. SVF cells obtained from EWAT from HFD-fed mice. Cells gated for F4/80+ ATMs and analyzed for expression of markers of type 1 (CD11c) and type 2 (CD206) ATMs. Data shown as percentage of SVF, total cells, and normalized to tissue weight. *, P < 0.05 vs Mgl1+/+. n = 6 per group. (D) Ratio of CD11c+ (type 1) ATMs to CD206+ (type 2) ATMs. (E) Confocal microscopy of adipose tissue from HFD-fed Mgl1−/− and control mice. Caveolin staining identifies intact adipocytes. Isolectin identifies CLSs and vasculature. Samples from EWAT. Bars, 50 µm. (F) Composite images from tips of EWAT fat pads stained for Mac2+ ATMs. Bars, 500 µm. (G) Plasma cytokine analysis from HFD-fed Mgl1−/− and WT mice. n = 6 mice per group. **, P < 0.05. Samples combined from two independent sets of mice.
Figure 5.
Figure 5.
MGL1 is expressed on and regulates levels of 7/4hi blood monocytes. (A) Quantitation of 7/4hi and 7/4mid monocytes in blood from ND and HFD-fed Mgl12/2 and control mice by flow cytometry. n = 12 mice per group. (B) Quantitation of 7/4hi and 7/4mid monocytes in BM from HFD-fed Mgl12/2 and control mice by flow cytometry. n = 6 mice per group. (C) MGL1 expression in 7/4hi inflammatory monocytes. Flow cytometry performed on blood from male mice. 7/4hi Ly6G inflammatory monocytes (R1, gray) and 7/4mid Ly6G (R2, white) were gated and analyzed for MGL1 expression. Representative plot shown from five independent experiments. (D) MGL1 expression in blood monocytes with HFD-induced obesity. MFI of MGL1 staining for monocyte subtypes in ND and HFD-fed C57BL/6 mice. Staining of Mgl1−/− monocytes shows antibody specificity. n = 4 mice per group. *, P < 0.05. Data are representative of data combined from two to three independent sets of animals.
Figure 6.
Figure 6.
Decreased inflammatory activity in Mgl1−/− PMs. (A) Decreased half-life of Mgl1−/− monocytes after adoptive transfer. Circulating CD11b+ monocytes were quantified in the blood 1 and 3 d after i.v. injection of 2 × 10⁶ CFSE-labeled monocytes into C57BL/6 mice. n = 9 per group. (B) Quantitation of PMs after injection in Mgl1−/− and control mice. Peritoneal cells were assessed 18 and 72 h after i.p. TG injection into Mgl1−/−, Ccr2−/−, and control mice. n = 4 mice per group. (C) MGL1 expression on TG elicited PMs. Flow cytometry for MGL1 expression on PMs isolated from mice with and without TG injection. Expression presented as MFI of MGL1 expression in F4/80+ cells. n = 4 per group. (D) TNF expression in macrophages from Mgl1−/− and control mice. PMs were isolated from mice and stimulated with or without 0.1 µg/ml LPS in complete media for 6 h. Cells were stained for intracellular TNF expression and quantitated by MFI. n = 4 per group. All data were observed in two independent experiments.
Figure 7.
Figure 7.
MGL1 regulates monocyte adhesion to adipocytes. (A) Monocytes from Mgl1−/− mice have decreased adhesion to adipocytes. 0.5 × 10⁶ CFSE-labeled monocytes were incubated with differentiated 3T3-L1 adipocytes for 30 min. After extensive washing to remove nonadherent cells, wells were fixed and stained with DAPI (blue). Images were analyzed by quantifying CFSE+ cells (pink) that were attached to adipocytes and normalizing this number to the number of adipocytes per high-power field. Eight images were analyzed from four independent experiments. *, P < 0.05. (B) Mgl1−/− monocytes have normal adhesion to endothelial cells. After treatment of bEnd.3 monolayers with or without TNF (50 ng/ml), 0.5 × 10⁶ CFSE-labeled monocyte were added to the wells. After 30 min, cells were washed and fixed. Adherent CFSE cells were quantitated by imaging at 200X. Two images were analyzed from each of eight independent samples, and the experiment was repeated twice. (C) Lewis X is not detected in epididymal adipose tissue from lean ND-fed mice. Epididymal fat pads from ND-fed C57BL/6 mice were stained with anti-Lewis X antibodies and isolectin to identify blood vessels. (D) Lewis X is highly expressed in CLS in visceral adipose tissue from obese HFD-fed mice. Epididymal fat pads from HFD-fed C57BL/6 mice were stained with anti-Lewis X antibodies and isolectin to identify blood vessels. Representative images are shown. Similar results were obtained from three independent samples. Bars, 50 µm.

Similar articles

Cited by

References

    1. Arkan M.C., Hevener A.L., Greten F.R., Maeda S., Li Z.W., Long J.M., Wynshaw-Boris A., Poli G., Olefsky J., Karin M. 2005. IKK-beta links inflammation to obesity-induced insulin resistance. Nat. Med. 11:191–198 10.1038/nm1185 - DOI - PubMed
    1. Auffray C., Fogg D., Garfa M., Elain G., Join-Lambert O., Kayal S., Sarnacki S., Cumano A., Lauvau G., Geissmann F. 2007. Monitoring of blood vessels and tissues by a population of monocytes with patrolling behavior. Science. 317:666–670 10.1126/science.1142883 - DOI - PubMed
    1. Baumann C.A., Ribon V., Kanzaki M., Thurmond D.C., Mora S., Shigematsu S., Bickel P.E., Pessin J.E., Saltiel A.R. 2000. CAP defines a second signalling pathway required for insulin-stimulated glucose transport. Nature. 407:202–207 10.1038/35025089 - DOI - PubMed
    1. Bouhlel M.A., Derudas B., Rigamonti E., Dièvart R., Brozek J., Haulon S., Zawadzki C., Jude B., Torpier G., Marx N., et al. 2007. PPARgamma activation primes human monocytes into alternative M2 macrophages with anti-inflammatory properties. Cell Metab. 6:137–143 10.1016/j.cmet.2007.06.010 - DOI - PubMed
    1. Bourlier V., Zakaroff-Girard A., Miranville A., De Barros S., Maumus M., Sengenes C., Galitzky J., Lafontan M., Karpe F., Frayn K.N., Bouloumié A. 2008. Remodeling phenotype of human subcutaneous adipose tissue macrophages. Circulation. 117:806–815 10.1161/CIRCULATIONAHA.107.724096 - DOI - PubMed

Publication types

MeSH terms